This month we take a closer look at the near-term health of the largest 20 pure play Tier 1 CRBs, as we consider what investors have to look forward to given the recent wave of optimism in the cannabis industry. It is no great revelation when we say that cannabis equities have been excessively volatile since their emergence half a decade ago, and it would be an understatement to claim that nearly all of the hysterical trade activity to date has been reactive and sentiment-based. It has. [We will be undoubtedly writing about CRB equity volatility in the months to come].
Truth be told, fundamentals in the cannabis space have not changed radically in recent months and the elephant in the room has been progress (or lack thereof) toward decriminalization, and ultimately legalization in the US. We have written about this quite often and it is no mystery to even the casual observer that there will be very limited value in these companies until cannabis becomes a “mainstream” industry in the eyes of the US federal government.
But with all that said, with the prospect of rescheduling and SAFER banking on the horizon, the survivors are likely to benefit in the long term as legal cannabis evolves and breaks away from dispensary-only sales and ultimately starts making its appearance in pharmacies, package stores, and supermarkets.
Which brings us to the current state of the cannabis industry. We took a plunge into the recent balance sheets and income statements of a list of relevant, publicly traded, pure play Tier 1’s to see how they might be faring today and what their prospects are going forward. We are painfully aware that the immediate future of legal cannabis is still quite uncertain, and as such the best we can do is take a look at what the comparative data might say about the near term prospects of this perennial emerging market.
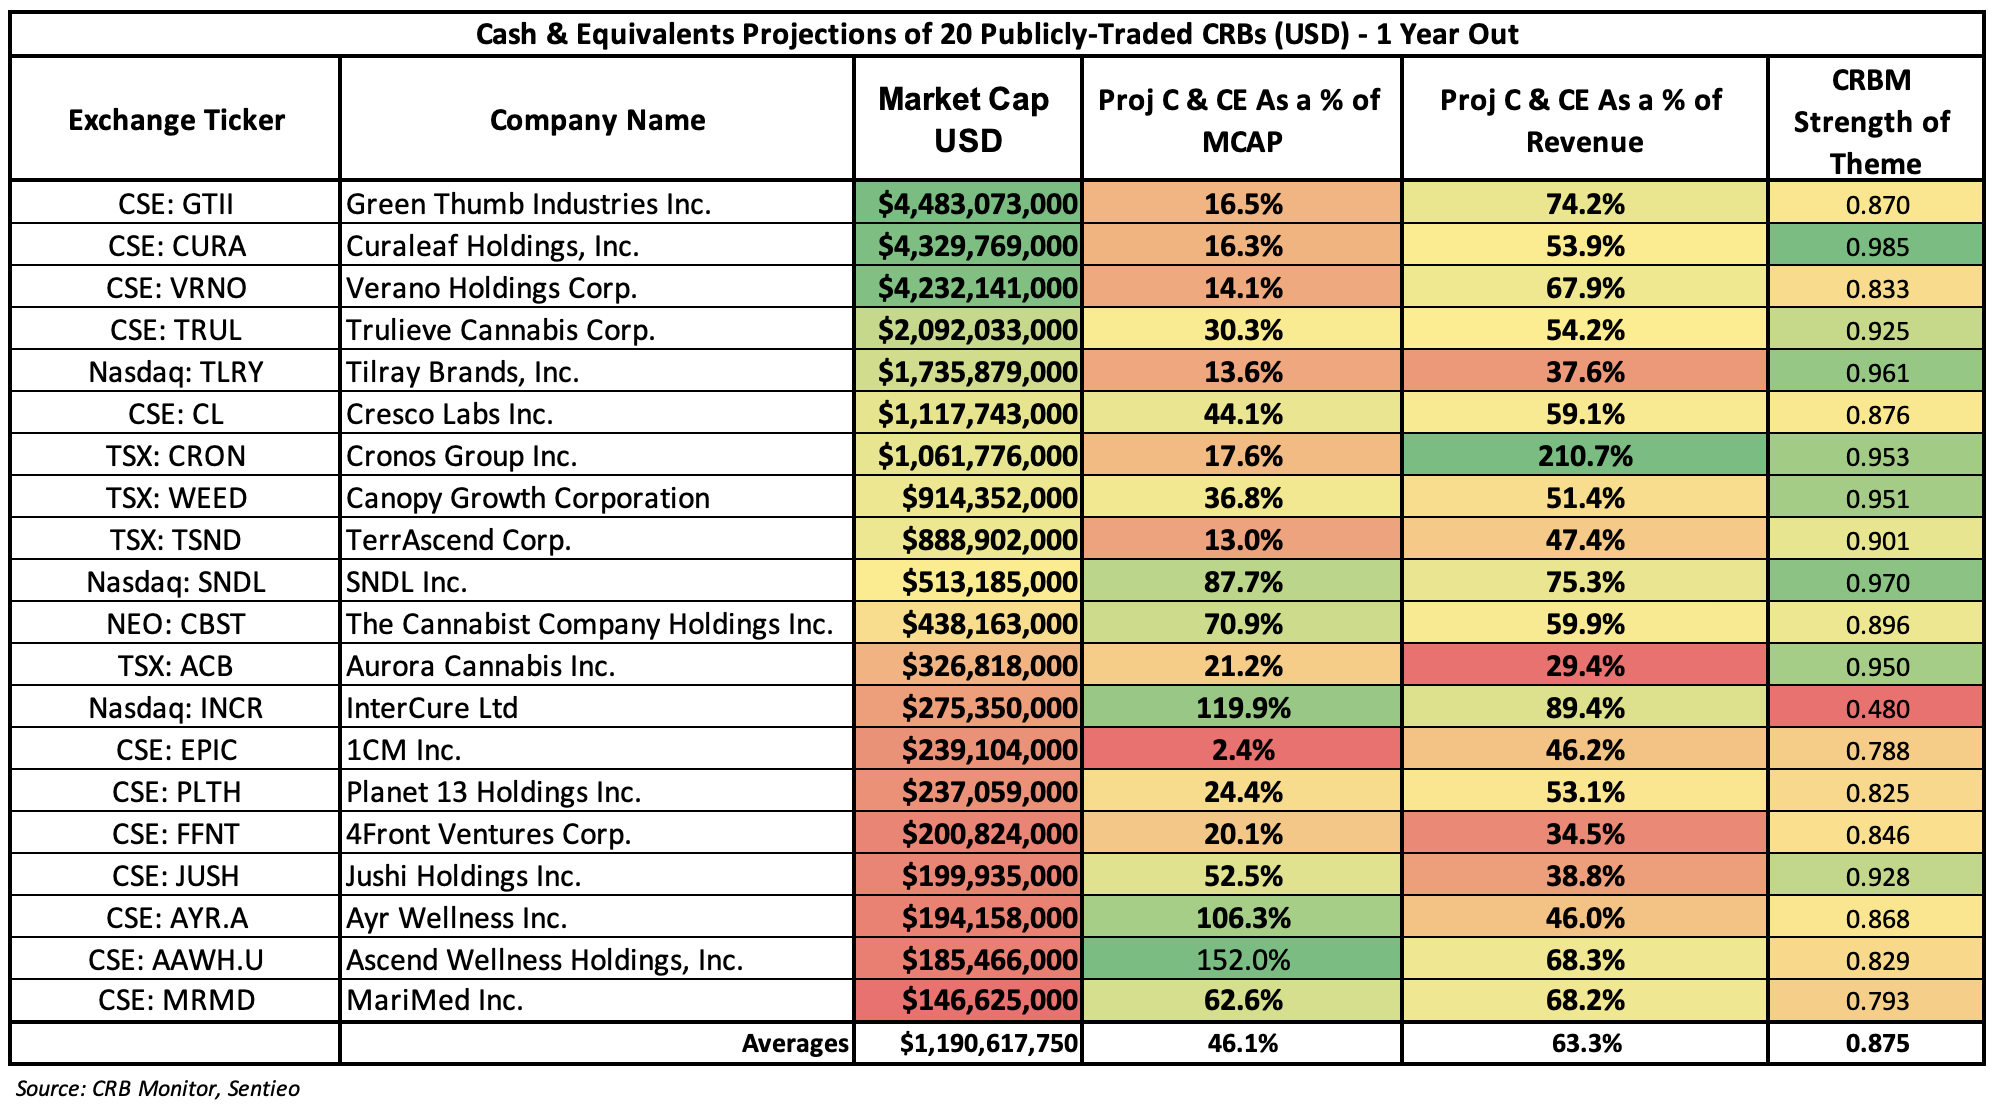
The ”chart of the month” is actually a table of the largest 20 pure play Tier 1 CRBs. What we have done is extract cash, revenue, and expense data from the last 2 years of balance sheets and income statements in order to project the next 12 months of balance sheet cash and cash equivalents assuming the status quo on the income statement.

What the above table indicates is that there is a varying approach to financial management across this list of the largest Tier 1 CRBs, and the level of cash and cash equivalents on the balance sheet does not necessarily reflect the size of either the company or its revenues. With that said, the three largest CRBs (GTII, CURA, VRNO) all have projected excess cash in a range of 14-16.5% of market cap. Others in that general range include TLRY, CRON, and TSND. Companies sporting a higher projected balance of cash and cash equivalents are TRUL (30%), CL (44%), and WEED (36%).
We also thought it might be interesting to add another dimension by cross-referencing these numbers with recent CRB Monitor Strength of Theme data. A critical factor in the construction of the Nasdaq CRB Monitor Global Cannabis Index (HERBAL), Strength of Theme is a comparative measure of operational diversification that is constructed using license data and other information from the CRB Monitor database. While the SOT factors do not appear to have a wide range, there are some noteworthy differences and those CRBs that are green in both the % of cash column and the SOT column might be considered the less risky of the bunch, although we would add the disclaimer that these are projections and therefore please, no wagering!
Said in a different way, CRB Monitor is not in the business of stock selection or making buy/sell recommendations; however, our research provides some insight into the overall strength and health of the companies that are fighting this battle every day. And the delicate management of cash is that essential tool that is used by each management team to strike a balance between risk and return in this environment of uncertainty.


