We periodically analyze the historical performance of several components of the publicly-traded, cannabis-related equity universe, as this information can provide insights into the outside forces that have had a material impact on the space. And while there were no major surprises this time, it was a worthwhile exercise nonetheless.
We need to remind ourselves that cannabis equities of all types have taken a massive hit over the last few years, and we are not likely to see a complete recovery any time soon. The lack of a resolution on federal legalization, banking reform, or DEA rescheduling has severely hamstrung the industry and placed it at a significant disadvantage versus any category you would like to place it in (pharmaceuticals, consumer discretionary, beverages and tobacco, etc.).
It’s difficult to find any silver linings as we look at the recent history of Tier 1 and Tier 2 pure play cannabis companies, as they have had to navigate the same consistent headwinds for several years while global markets have flourished. And sadly the long-lasting collapse of the industry has translated into significantly smaller market caps, thinner trade volumes, and higher volatility across the board. As such, the cannabis equity market is now largely off-limits to institutional investors.
With all that said, CRB Monitor is still committed to providing our customers with the most comprehensive and current expression of the global cannabis ecosystem, given its persistent importance to stakeholders and risk managers worldwide.
First, here is a quick review of the definitions of the portfolios in this analysis:
Tier 1 Pure Play Multistate Operator (MSO) CRB: A publicly-traded cannabis related business which either directly, or through a subsidiary holds licenses issued by more than one regulatory authority in the United States to cultivate, manufacture, process, wholesale, retail, test, etc., marijuana or hemp. Furthermore, this CRB’s cannabis-related revenue is determined to constitute more than 50% of the company’s overall revenue. Companies in this basket include Green Thumb Industries Inc. (CSE: GTII), Curaleaf Holdings Inc. (CSE: CURA), Trulieve Cannabis Corp. (CSE:TRUL), and Verano Holdings Corp. (CSE: VRNO).

Tier 1 Pure Play Canadian CRB: A publicly-traded cannabis related business which either directly, or through a subsidiary, holds a license issued by one or more Canadian regulatory authority to cultivate, manufacture, process, wholesale, retail, test, etc., marijuana or hemp. CRBs in this group hold no licenses, either directly or indirectly, from a US-based regulatory authority. Furthermore, this CRB’s cannabis-related revenue is determined to constitute more than 50% of the company’s overall revenue. Companies in this basket include Canopy Growth Corp. (TSX: WEED), Tilray Brands, Inc. (Nasdaq: TLRY), SNDL Inc. (Nasdaq: SNDL), and High Tide, Inc. (TSX: HITI).
Tier 2 CRB: A publicly-traded cannabis related business (CRB) which provides goods and/or services to a Tier 1 CRB or is a pure play unlicensed CBD (not THC) business. Furthermore, a Tier 2 CRB’s cannabis-related revenue is determined to constitute more than 50% of the company’s overall revenue. Companies in this basket include Innovative Industrial Properties Inc. (NYSE: IIPR), Advanced Flower Capital Inc. (Nasdaq: AFCG), and NewLake Capital Partners Inc. (OTCQX: NLCP).
Also included, for comparative purposes, are three popular broad market index exchange traded funds:
SPDR S&P 500 ETF Trust (NYSE: SPDR) (US Equities)
Vanguard Emerging Markets Stock Index Fund ETF (NYSE: VWO) (Emerging Markets Equities)
EFA: iShares MSCI EAFE ETF (NYSE: EFA) (Non-US Developed Markets Equities)
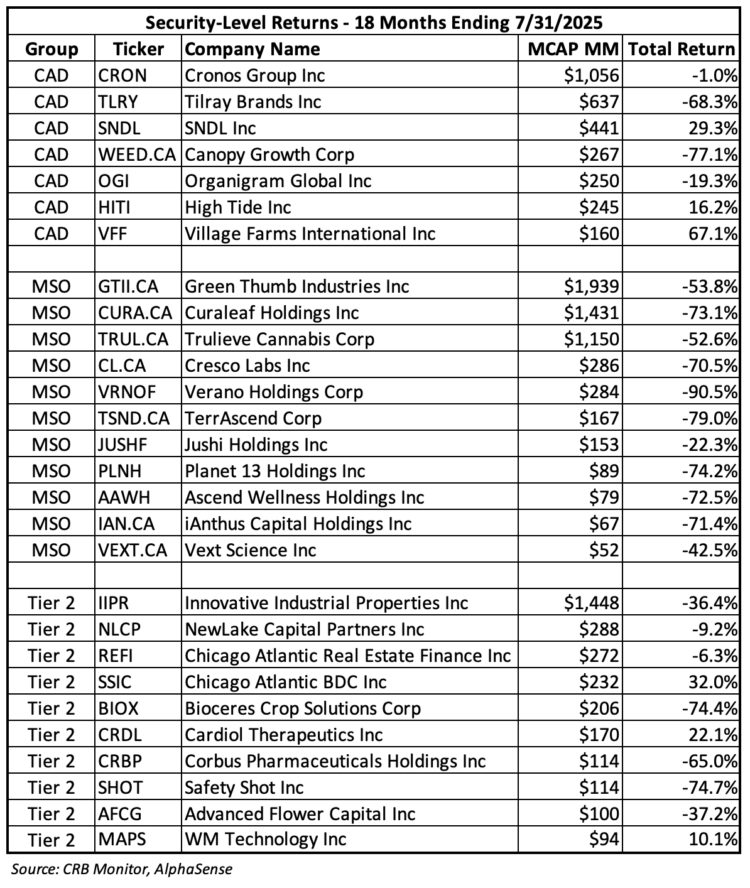
For context, here are the market caps and 18-month returns of the individual companies that make up each equally-weighted portfolio:
Recent Performance History
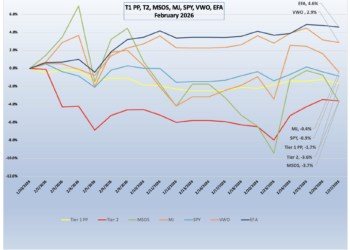
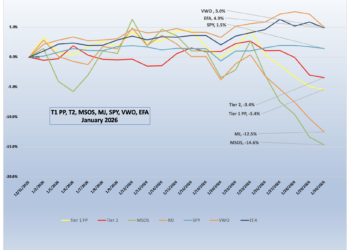
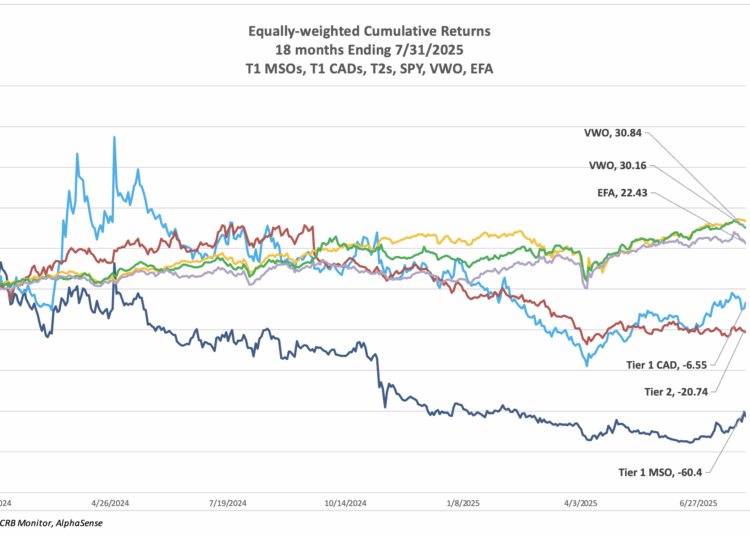
It isn’t easy to find an extended period in the brief history of cannabis equities when they performed consistently well. It is for that reason that the chart and table above are likely to give indigestion to cannabis industry stakeholders, but that’s how things have gone over the last half decade or so.
As has been the case historically, the Tier 1 MSO vs. Tier 1 CAD relationship has largely held; however, over the last 18 months we have seen a significant deviation between the two baskets. Investors that have overweighted “CSA-compliant” (aka, non-US plant-touching) cannabis exposure have been the big winners, even though their performance was still under water.
Also of note: We wrote about the 2024 spike in the Tier 2 basket in the last installment of this analysis, attributing it to big news from Corbus Pharmaceutical’s development of a new drug (unrelated to cannabis). The Corbus rally skewed the return of the Tier 2 basket and consequently widened the spread of Tier 1 vs. Tier 2 CRBs, which otherwise would have performed significantly closer to the Tier 1 group. Over the last 18 months, however, Tier 2 performance has been somewhat normalized and once again is more in-line with the Tier 1 baskets.
Here are the correlations, which have held reasonably firm over time:
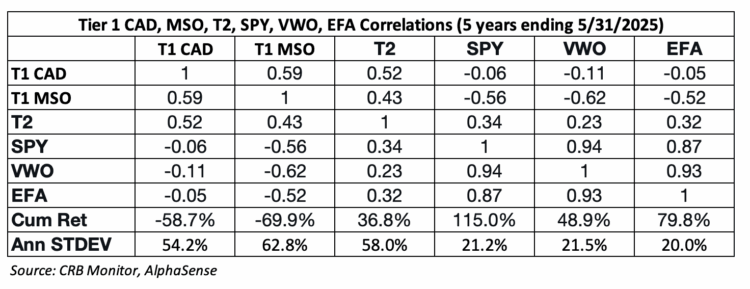
Tier 1 MSO/Tier 1 CAD: The correlation of these two baskets (0.77) continues to be high, as it has been historically. With that said, we have witnessed a significant deviation in performance which is likely a reflection of the politics that have created headwinds for MSOs for the last decade. The non US-plant touching group (CAD) appears to have been spared much of this impact, and we might be witnessing some decoupling of these two baskets as Canadian CRBs might be losing their collective hope for cross-border trade. Legalization, as well as DEA re-scheduling and banking reforms would open the doors for inter-state and international cannabis transactions which would, presumably, maximize earnings. As we have seen, the inability of the US government to pass any federal cannabis reforms has led to disappointing returns and high volatility (as demonstrated by the standard deviations above).
Tier 1 Pure Play/Tier 2: Our analysis shows that Tier 2 CRBs are highly correlated with both the Tier 1 MSO basket and the CAD basket. That being said, the Tier 2 basket (besides IIPR) has been decimated in recent years and several of the companies in this group do not trade every day and these shrinking volumes have made the Tier 2 basket largely uninvestable for most institutional investors.
CRBs and Global Equities: We included three equity ETFs in our analysis for comparative purposes – U.S. Large Cap (SPY), International developed markets (EFA) and Global Emerging Markets (VWO). We are seeing that, as expected, cannabis equities have not been a good proxy for global equities and vice versa. In fact, both Tier 1 baskets are negatively correlated with all three of these popular ETFs. The Tier 2 group was negatively correlated with these ETFs as well.
As we have reported for several years, cannabis equities are a real “triple threat” (negative correlation with global equities, negative returns, and high risk). And while industry stakeholders of all types cannot be pleased with this long term performance history, many hang onto their investments with the hope that cannabis equities eventually make their way into the main stream.
Wondering what a Tier 1, Tier 2 or Tier 3 CRB is?
See our seminal ACAMS Today white paper, Defining “Marijuana-Related Business,” and its update, Defining “Cannabis-Related Business”.
Wondering what a Tier 1, Tier 2 or Tier 3 DARB is?
See our seminal ACAMS Today white paper Defining ‘Digital Asset-related Business’ and Digital-Asset Related Businesses – What Financial Institutions Need to Know