This month we are taking fresh look at the near-term health of the largest 20 pure play Tier 1 CRBs, as we consider what investors have to look forward to given the latest wave of positive sentiment in the cannabis industry. Similar to our original analysis in 2023, sentiment (relative to fundamentals) overwhelmingly drives cannabis equity prices. Bid-ask spreads have widened and trade volumes have shrunk to the point where the mere hint at progress toward (or a stall from) cannabis reform can move markets by double digit percentages. In other words, cannabis equity volatility has not changed in the 2 years since we published the original analysis.

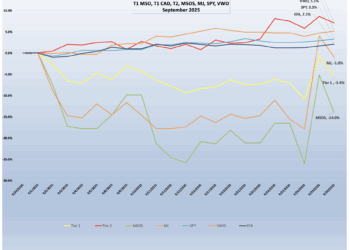
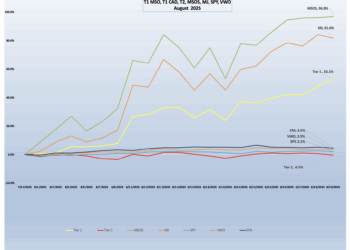
Besides the fact that the relationship between Tier 1 and Tier 2 CRBs eventually mean reverts (which it has), we can see that cannabis stocks significantly underperformed the broad US market. Why is it important to look at this chart? We feel that cannabis equities are largely sentiment-driven, and tend to rise and fall based on the progress (or lack thereof) toward reforms in the United States. These sentiments tend to fall into the categories of “hope” and “lost hope”, and for the above-referenced time period, cannabis equities delivered a positive return, albeit far lower than US equities (around 20% for both Tier 1 and Tier 2).
Aside from sentiment this performance will always be dampened by CRBs’ headwinds at the state level, whereby they are not only taxed at a high rate, but also face competition from both the illicit marijuana market and now intoxicating hemp as well. If and when these headwinds (along with federal legalization and bank reforms) are dealt with permanently, the performance for cannabis equities might be more in line with the US market. But not yet.
Balance Sheet Cash and Cash Equivalents
The two tables below, the first from our original 2023 Chart of the Month and the second from 2025, show the largest 20 pure play Tier 1 CRBs at the time of each of the analyses. For each of these companies we extracted cash, revenue, and expense data from the previous 2 years of balance sheets and income statements in order to project the next 12 months of balance sheet cash and cash equivalents assuming the status quo on the income statement.


What should jump out first, before digging into the financials, are the incredible shrinking market caps for these companies. Even with the meteoric returns of the last 2 months, cannabis equities have gotten so small that investors could easily (either intentionally or otherwise) overlook them. Some institutions’ compliance screens might toss a number of them on a restrictions list for their size and average trade volume alone, not just due to their illegality. Household names like Green Thumb, Curaleaf, and even industry titans like Canopy Growth have lost more than half their value in the last two years alone and most of the above companies have lost more than 80% from their 2021 historical highs.

12-Month Cash Projections
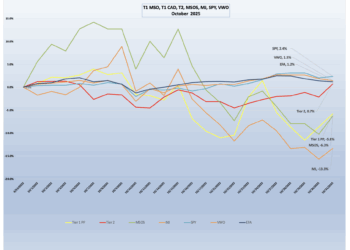
The other really interesting development is the trend in CRBs’ cash projections as a percentage of market cap. Using the last 12 months’ income statements, we estimated cash balances 12 months into the future (September 2026) and calculated their percentage of market cap and revenue. And what a difference a couple of years has made. For the most part, cash and cash equivalents have grown as a percentage of market cap, which indicates that cash has remained stable as market caps have shrunk. This reflects a defensive position, which should be no surprise given the state of the cannabis industry and all of its prevailing headwinds.
As we noted with our original pass at this research, we see a varying approach to financial management across this list of the largest Tier 1 CRBs, and the levels of cash and cash equivalents on the balance sheet do not necessarily reflect the size of either the company or its revenues. With that said, the three largest CRBs (CURA, GTII, TRUL) all have projected excess cash in a range of 30-45% of market cap – a drastic increase from 2023, largely due to depressed share prices. Most of the rest of the CRBs on the list are similar if not higher, while Vireo Growth and Grown Rogue maintain a comparatively low cash balance (9% and 14%, respectively).
We found a few extreme examples of CRBs playing defense – Ascend Wellness (232%), High Tide (118%) and SNDL (94%). Why are these numbers so outrageously high? There are several explanations, such as risk management, preservation of working capital, and downside protection. But this approach also comes at a price, given that money that is held in cash is not being put to work earning revenue or investment returns.
We also thought it might be interesting to add another dimension by cross-referencing these numbers with recent CRB Monitor Strength of Theme (SOT) data. Strength of Theme is a comparative measure of operational diversification that is constructed using license data and other information from the CRB Monitor database. While the SOT factors do not appear to have a wide range, there are some noteworthy differences and those CRBs that are green in both the % of cash column and the SOT column might be considered the less risky of the bunch, but we would add (as we stated above) extremely high cash balances can be a drag on operating revenue and share returns.
CRB Monitor is not in the business of stock selection or making buy/sell recommendations; however, our research provides some insight into the overall strength and health of the companies that are fighting this battle every day. And the strategy behind the management of cash is a bet that strikes a delicate balance between risk and return in this environment of uncertainty.
Wondering what a Tier 1, Tier 2 or Tier 3 CRB is?
See our seminal ACAMS Today white paper, Defining “Marijuana-Related Business,” and its update, Defining “Cannabis-Related Business”.
Wondering what a Tier 1, Tier 2 or Tier 3 DARB is?
See our seminal ACAMS Today white paper Defining ‘Digital Asset-related Business’ and Digital-Asset Related Businesses – What Financial Institutions Need to Know