2025 marked another period of significant recalibration and transition for the regulated cannabis industry in the United States. While the total number of active licenses shrank, the pipeline of future growth — represented by approved/pending and pre-licensing applications — showed signs of stabilization after a prolonged slump.
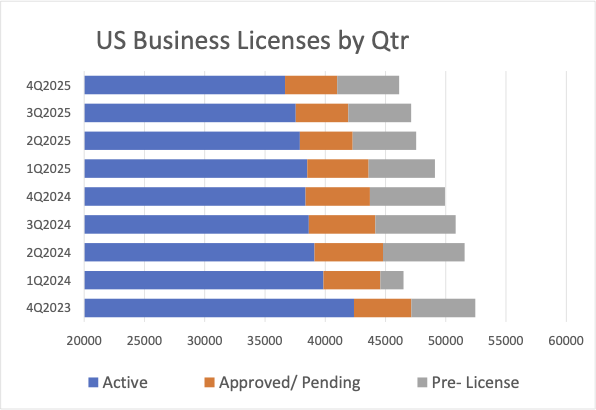
The total number of active cannabis-related business (CRB) licenses continued its multi-year decline in the fourth quarter of 2025, falling 2% to 36,665, a trend that has now persisted in 12 of the last 13 quarters. This overarching narrative of market rationalization is driven by the consolidation of mature markets like California, Colorado, and Oklahoma, which are shedding operators even as newer markets like New York and New Jersey continue their measured expansion.
The story of the quarter, and indeed the year, is one of a market bifurcating between the disciplined contraction of established markets and the deliberate, bureaucratic rollout of new adult-use states. These markets are no longer characterized by explosive, widespread growth but by strategic positioning, geographic realignment, and a focus on operational sustainability. Meanwhile, the Canadian market has reached a state of equilibrium, providing a potential glimpse into the future of a mature, nationally regulated industry.
Total active U.S. licenses: The rationalization continues
 The cornerstone of the Q4 2025 licensing landscape is the persistent decline in the total number of active operators. The 2% quarterly drop to 36,665 extends a multi-year decline first evidenced in the fourth quarter of 2022. This is not a seasonal fluctuation, but a structural market correction. The 4% reduction for the full year 2025 caps a staggering 14% drop in active licensees over the past two years, underscoring the intensity of the industry’s consolidation phase.
This decline is the result of several converging pressures. In established markets, intense competition, falling wholesale prices, and regulatory compliance costs are forcing out marginal or non-compliant operators. This shakeout is a natural, if painful, evolution of a maturing industry. Licensing data tracked by CRB Monitor for all U.S. and Canadian jurisdictions suggests that markets are reaching a new equilibrium, where the number of operators aligns more closely with actual market demand and profitability. The consecutive quarterly reductions signal that this correction is not yet complete, but the pace may be slowing as the market approaches a sustainable floor, as seen in Canada’s recent stability.
The shrinking pipeline: Approved/pending and pre-licensing activity
The forward-looking indicators of U.S. market growth paint a complex picture of a market in transition. Both approved/pending licenses (those approved but not yet operational) and pre-licensing applications (those under review) saw declines, yet the details reveal the powerful influence of a few key states.
Approved/Pending licenses fell 1% in Q4 to 4,330, marking the sixth consecutive quarterly decline. The 19% annual drop from 2024 levels appears dramatic, but the quarter-over-quarter stability (only 1% less than six months ago) is significant. This stabilization is largely attributed to New York, where a large cohort of applications finally moved through the processing pipeline. This suggests that while the national appetite for new approvals has cooled, the backlog in the nation’s newest major market is slowly being converted into operational businesses.

Pre-Licensing activity (applications in review) experienced a similar trajectory, falling 2% to 5,136. This extends a decline that began in Q3 2024, driven almost exclusively by New York’s efforts to clear its enormous application backlog. The Empire State’s dominance in this category is absolute. It accounted for 88% of all new applications in review nationally, with 4,568 applicants awaiting approval. The fact that New York processed over 1,200 new operators from a backlog of more than 4,500 demonstrates the sheer scale of its market build-out. Nationally, pre-licensing activity is 18% lower than two years ago, a stark indicator of the broad change in sentiment among cannabis operators and investors as the gold-rush mentality of five years ago has given way to a more cautious, calculated approach to market entry.
License type dynamics: The rise of vertical integration
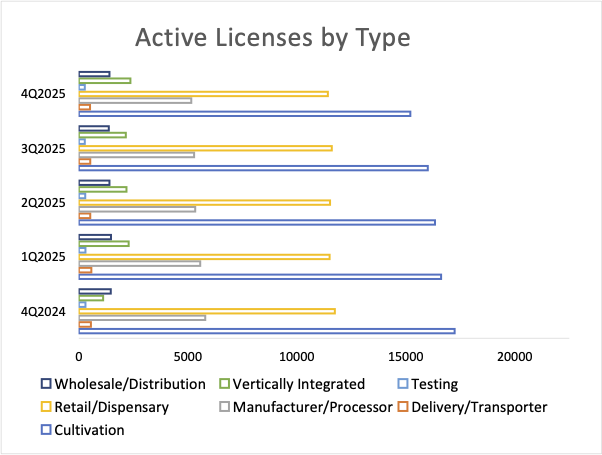
 An analysis by license type reveals shifting business strategies and regulatory impacts. Cultivation (15,207) and retail (11,421) licenses remain the dominant categories, together comprising 73% of all active licenses. However, both saw declines in Q4 (-5% and -2%, respectively), reflecting the consolidation pressures mentioned earlier. Seven states — California, Oklahoma, Michigan, Oregon, Washington, New Mexico, and Colorado — continue to be the epicenter of this activity, accounting for 75% of all cultivation and retail licenses.
The most dramatic trend in 2025 among operator categories, however, was the explosive growth of vertically integrated operators. The number of active vertical operators nearly tripled over the past two years, reaching a high of 2,362 by the end of 2025. This represents a 10% quarterly and a staggering 112% annual increase. While this suggests a powerful business model, much of this growth, particularly in early 2025, was not organic. In New Mexico, a one-time recharacterization of existing licensees reclassified almost 600 operators holding multiple licenses as single master vertical licensees. This regulatory re-labeling, rather than new market entry, artificially inflated the national numbers. New Mexico now leads the nation with over 900 such operators.
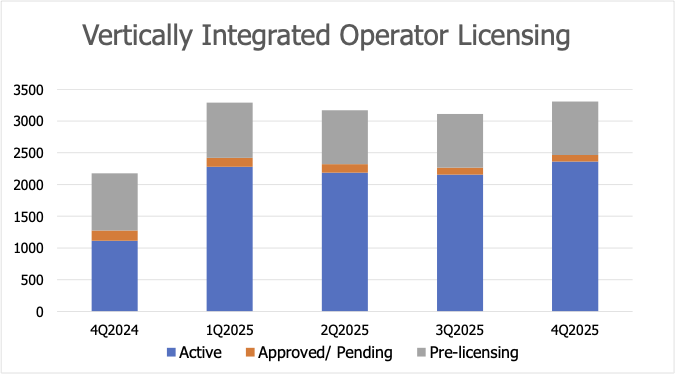
Despite this accounting anomaly, the vertical model’s appeal is undeniable. It offers greater control over supply chain, cost structure, and brand consistency — and for regulators, the prospect of greater compliance. Looking forward, this category is poised for genuine growth as New York works through more than 800 outstanding applications for new vertical operations. With over 300 active vertical operators already in the state by year’s end, New York is set to become a major hub for this business structure.
Other license types showed mixed results. Manufacturer/processor licenses (5,158) and wholesale/distribution licenses (1,404) saw a 3% decrease and 2% increase, respectively, indicating a relatively stable, albeit flat, supply chain sector.
The approved/pending pipeline: A closer look
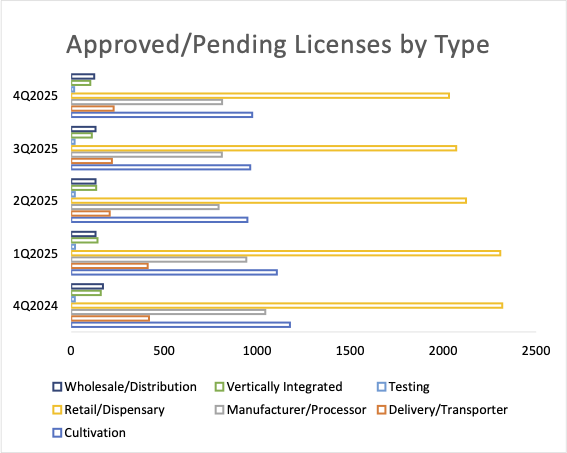 The composition of the approved/ pending pipeline offers clues about where future market capacity will emerge.
Cultivators saw a slight 1% increase in approved/pending licenses to 973, the only major category to show growth. However, this is still 17% lower than a year ago and down 25% over two years, reflecting the production consolidation in powerhouse states like California, Colorado, and Oklahoma. The market is signaling that it does not need a flood of new cultivation capacity.
Retailers hit a two-year low in new approvals, dropping another 2% to 2,031. The decline in established markets was muted by growth in newly opened states like Ohio and New York. This suggests that while store growth is slowing nationally, the center of gravity is shifting. New retail dollars will increasingly be captured by new stores in new markets, rather than by a proliferation of stores in already saturated ones.
Supply chain operators showed mixed results. The sharpest rise was in the smallest category, delivery/transporter licenses, which rose 4% to 228. This niche appears to be expanding, possibly in response to the logistical demands of sprawling new markets. In contrast, testing facility licensing continued a precipitous decline, falling 11% in the quarter to just 16 new facilities nationwide. This is a critical concern, as a lack of testing capacity can create bottlenecks and undermine regulatory oversight.
The pre-licensing landscape: New York dominates a shrinking field
The pre-licensing data reinforces the narrative of a market where interest in entry is concentrated in a few market-opening hotspots. The 2% quarterly decline in pre-licensing applications to 5,136 marks the sixth consecutive drop since a peak in early 2024.
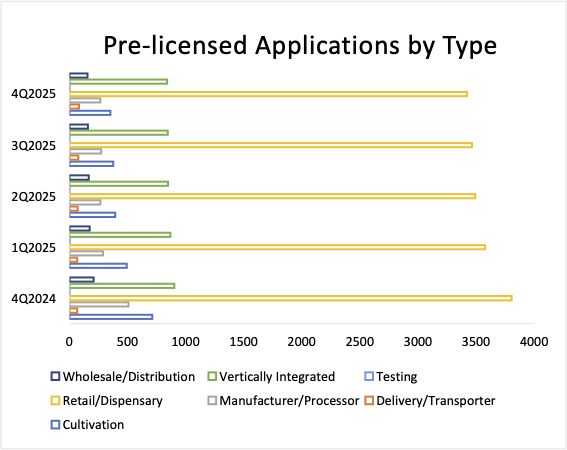 New applications declined across all major license types except one. Delivery/transporter applications were the sole exception, rising 8% to 83, largely tied to New York’s market build-out. This category was also the only one to experience year-over-year growth in 2025, rising 24%. This sustained interest in the logistics end of the business suggests a market need that is not being fully met by existing operators.
Retailers experienced the sharpest absolute decline, falling by 44 applications in the fourth quarter to 3,420. However, this headline number is misleading. New York applicants comprised a staggering 95% of all retail operator applications in review. This means that outside of New York, interest in opening new retail stores has virtually collapsed. The same dynamic is true for vertically integrated operators, where 825 of the 841 national pre-licensing applications are seeking New York permits.
The data is clear: without New York’s ongoing market activation, the national pre-licensing figures would be in a state of freefall. The 50% drop in cultivator applications and the 47% drop in manufacturer/processor applications year-over-year signal a decisive end to the expansion phase in most of the country.
Minor license types: Innovation at the margins
The minor license categories, those with fewer than 300 active licenses nationally, provide a window into emerging trends and niche markets. Activity here was mixed in 2025, with new concepts showing strong growth while older, more traditional support sectors declined.
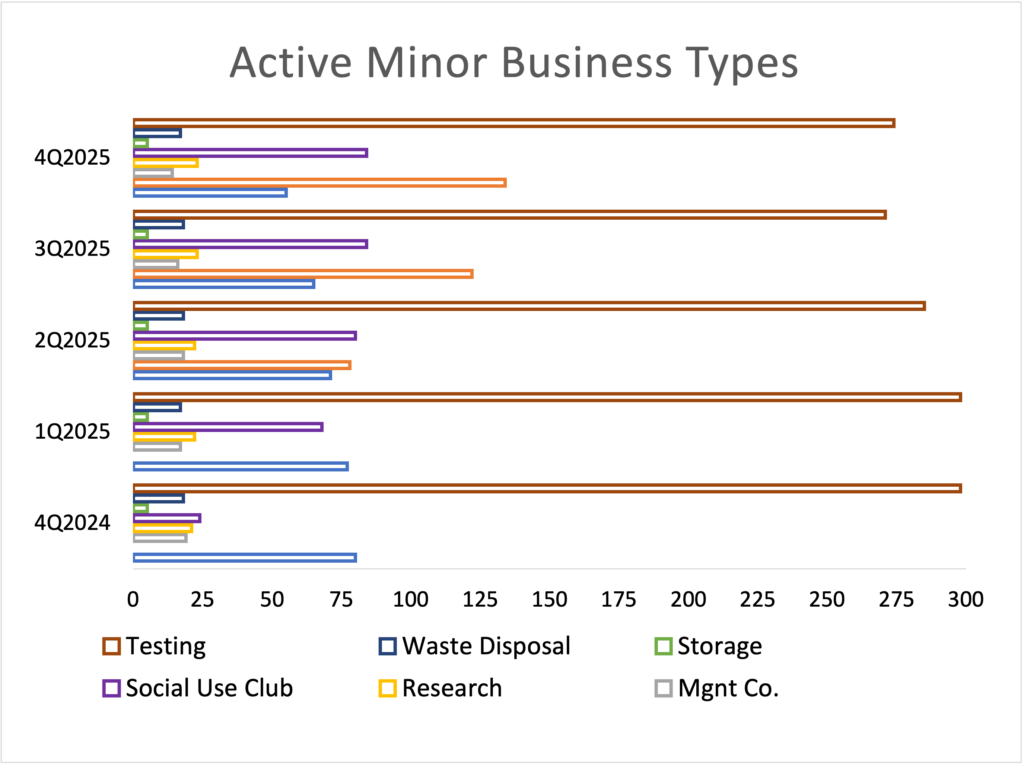
Licensed Brands, a new category exclusive to New York, exploded onto the scene, growing 72% in its first year to 134 permitted operators. This reflects a market structure that formally recognizes the separation of the brand from the cultivation, manufacturing, or retail functions, allowing for intellectual property-based business models.
Social Clubs showed the greatest annual growth rate, expanding 250% to 84 permitted operators, highlighting a demand for on-site consumption venues, even as no new permits were issued in Q4.
In contrast, Event Organizers continued a relentless three-year contraction, declining 31% for the year. Management companies also saw a wrenching 26% annual decline. These downturns suggest that the ancillary and support services sector is feeling the rationalization pressures just as acutely as the core plant-touching businesses.
The Canadian market: A portrait of maturity
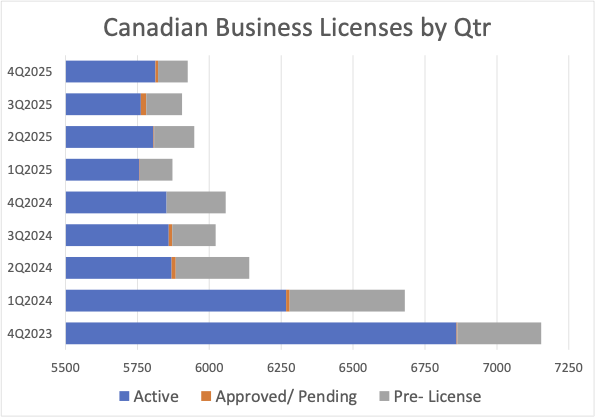 North of the border, the Canadian market presents a starkly different picture. Active Canadian business licensing was “essentially flat” for both Q4 and the full year, ending with 5,813 active permits. This stability has persisted for six consecutive quarters, establishing a clear floor on the number of active Canadian operators. This plateau comes after a two-year decline of 15%, suggesting that the Canadian market has completed its post-legalization shakeout and has found a sustainable size.
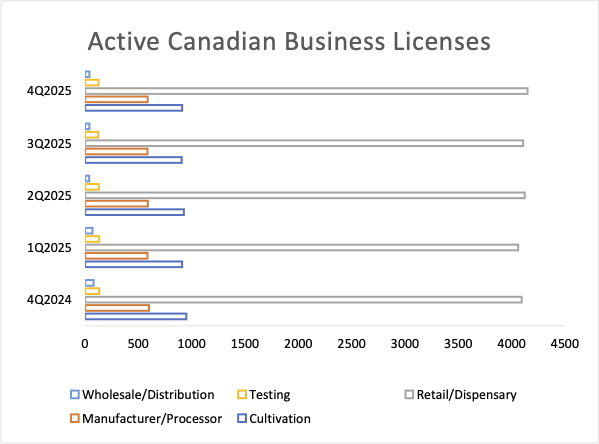 The lack of growth is evident in the pipeline. New license applications in review ended the year 50% lower than a year ago and a dramatic 65% lower than two years ago. The only sector showing significant movement was wholesale/distributors, which saw a collapse in the first half of 2025, losing 49% of its active licensees. This sharp draw-down likely reflects a consolidation in the middle of the supply chain as producers and retailers forge more direct and integrated relationships.
Retail dispensaries remain the largest license type (just over 4,100), showing virtually no growth over two years, while cultivation (911) and manufacturer/processor (587) sectors are similarly static. Canada has become a mature, stable market where the focus has shifted from expansion to operational efficiency and profitability within a fixed competitive landscape.
State-level analysis: A tale of many markets
The national trends are the sum of vastly different state-level stories. When these 46 discreet regulated markets are grouped into established and growing categories, the contrast between them is sharp.
 Established Markets (12 states with >500 operators, 2+ years old): Licensing trends were highly mixed, with total license counts growing an average of 10%, but this average obscures wide variances.
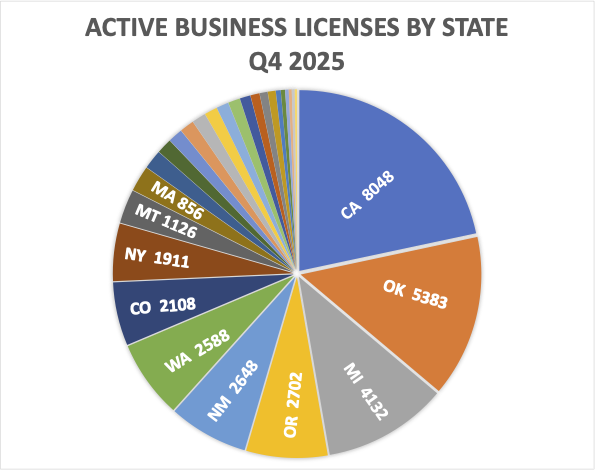
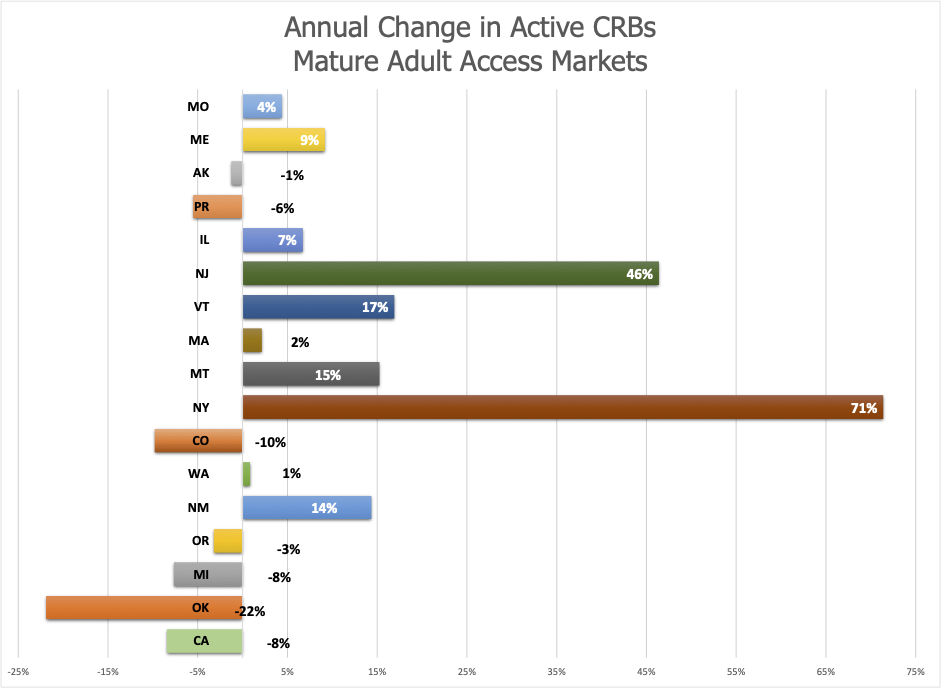
Growth States: New York (+413% for the year), New Jersey, Vermont, Montana, and New Mexico all saw double-digit annual growth, driven by adult-use transitions or, in New Mexico’s case, license recharacterization.
Contraction States: In contrast, Colorado (-10%) and Oklahoma (-22%) saw significant declines as they aggressively pruned their license rolls. California and Michigan, two of the largest markets, experienced 8% contractions, highlighting the intense competitive pressures in those states.
Stable States: Massachusetts (2%), Oregon (-3%), and Washington (1%) showed relative stability, suggesting their markets have largely balanced.
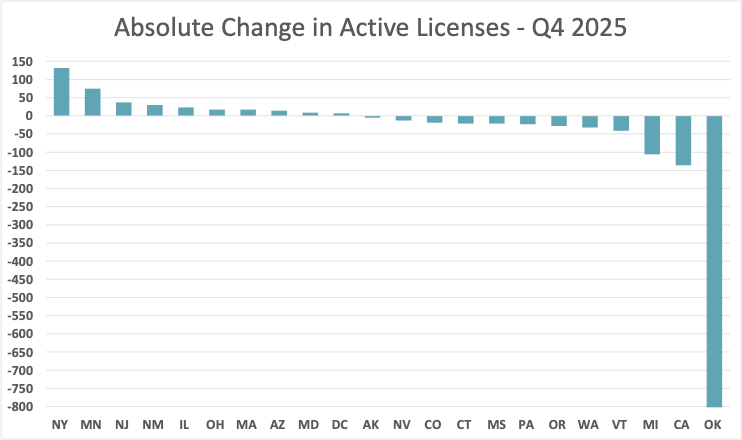 Oklahoma’s Ongoing Purge: The story of contraction is best told in Oklahoma. Now three and a half years into a moratorium and a crackdown on non-compliant operators, the state shed another 823 licensed businesses in Q4 alone. This represents a 15% quarterly drop and a staggering 56% reduction over two years. Despite this, Oklahoma remains the second-largest state cannabis market by total active licenses, a testament to how over-saturated it had become.
New York’s Ascent: New York again led large-population states in absolute growth, adding 132 licenses in Q4. This 7% quarterly increase brought its total to 2,043, a 413% increase over the past 12 months. The state is rapidly transforming from a newly opened market mired in pre-licensing bureaucracy to a major operational market.
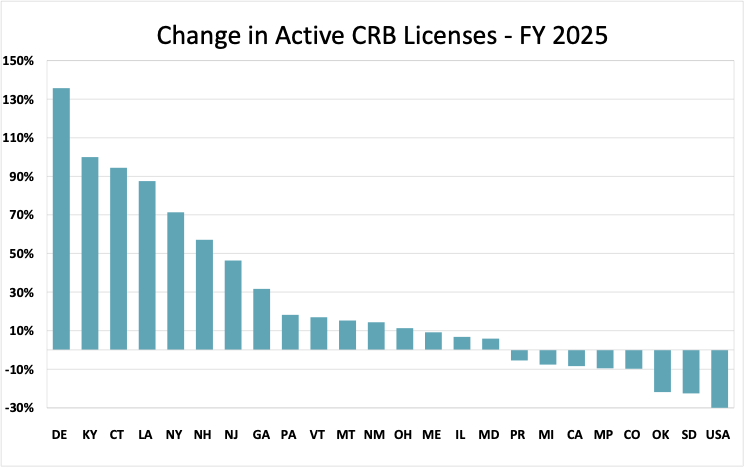
Other Notable Markets: Minnesota showed explosive relative growth (+268%) as it rolled out its adult-use program. New Jersey (+7%), D.C. (+7%), and Ohio (+6%) all showed steady, moderate growth.
Overall, 19 states gained licensees in Q4 while 14 lost them. This as a welcome reprieve from the broad multi-year retrenchment that preceded it, suggesting that while rationalization continues, it is no longer a universal phenomenon.
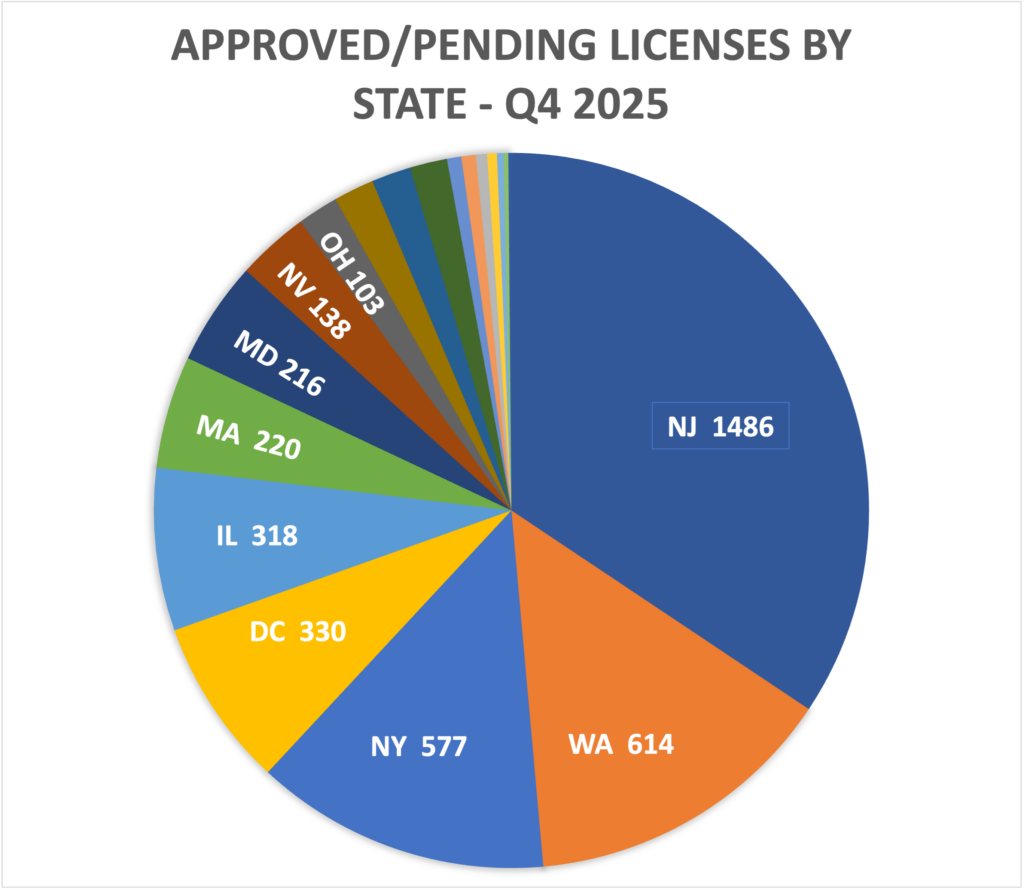 Approved/Pending at the State Level: This forward-looking indicator showed isolated pockets of activity. Washington state was the outlier, approving 614 new licenses in Q4 after a two-quarter pause, a massive injection of potential future capacity. No other jurisdiction approved more than 18. Conversely, West Virginia cleared its entire pending pipeline, dropping from 570 to zero, as it stood up its medical market. New Jersey retains the largest backlog of approved but not-yet-active licensees with 1,486, virtually unchanged from previous quarters, representing a massive reservoir of future market capacity if and when those permits are activated.
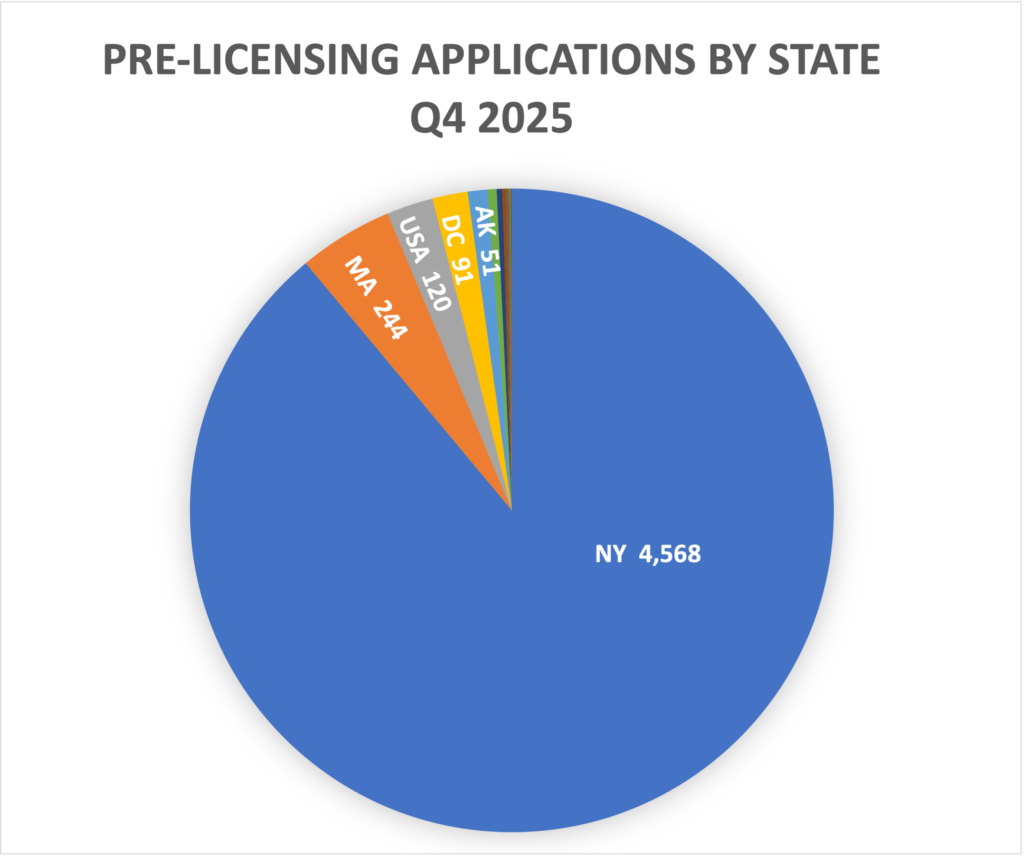 Pre-Licensing at the State Level: Activity was even more concentrated here. Only 10 states recorded any application activity in Q4, and all but one saw decreases. The District of Columbia was the sole exception, with a 2% increase to 91 applications as it worked through a new compliance program. New York’s pre-licensing count fell slightly by 1% to 4,568, but it remains the dominant force. Meanwhile, California, the nation’s largest cannabis market, ended the year with only seven new license applications in processing — a situation unchanged for five consecutive quarters. This is the ultimate symbol of a market that has closed its doors to new entrants, where the opportunity for growth lies in acquisition and consolidation, not in applying for a new license.
Conclusion
The state of the regulated cannabis market at the end of 2025 confirms that the U.S. cannabis industry has entered a new phase. The era of nationwide, explosive license growth is over, replaced by a complex patchwork of market conditions. The overarching theme is rationalization, as mature markets like California and Oklahoma correct for past over-saturation. Simultaneously, a secondary theme of measured, bureaucratic expansion plays out in newly opened states, with New York serving as the primary engine of national growth metrics.
The data points to a maturing industry where barriers to entry are higher, investor sentiment is more cautious, and operational excellence is paramount. The stability of the Canadian market offers a potential roadmap, suggesting that after a period of consolidation, a market can find an equilibrium. For the U.S., the path forward is less about the number of licenses and more about the quality and sustainability of the businesses that hold them. The focus is shifting from expansion to execution.