The first quarter of 2026 marked another period of contraction and stabilization across regulated cannabis licensing markets in North America. In the United States, total active business licenses fell for the seventh consecutive quarter, while Canadian markets exhibited a continued flatlining of active operator counts. New license approvals continued a multi-year decline, though new application submissions showed modest signs of a rebound in select categories and states. The most significant licensing activity remained concentrated in New York, Texas, and Washington, while established markets such as California, Oklahoma, and Michigan continued to shed licensees.
U.S. Overview
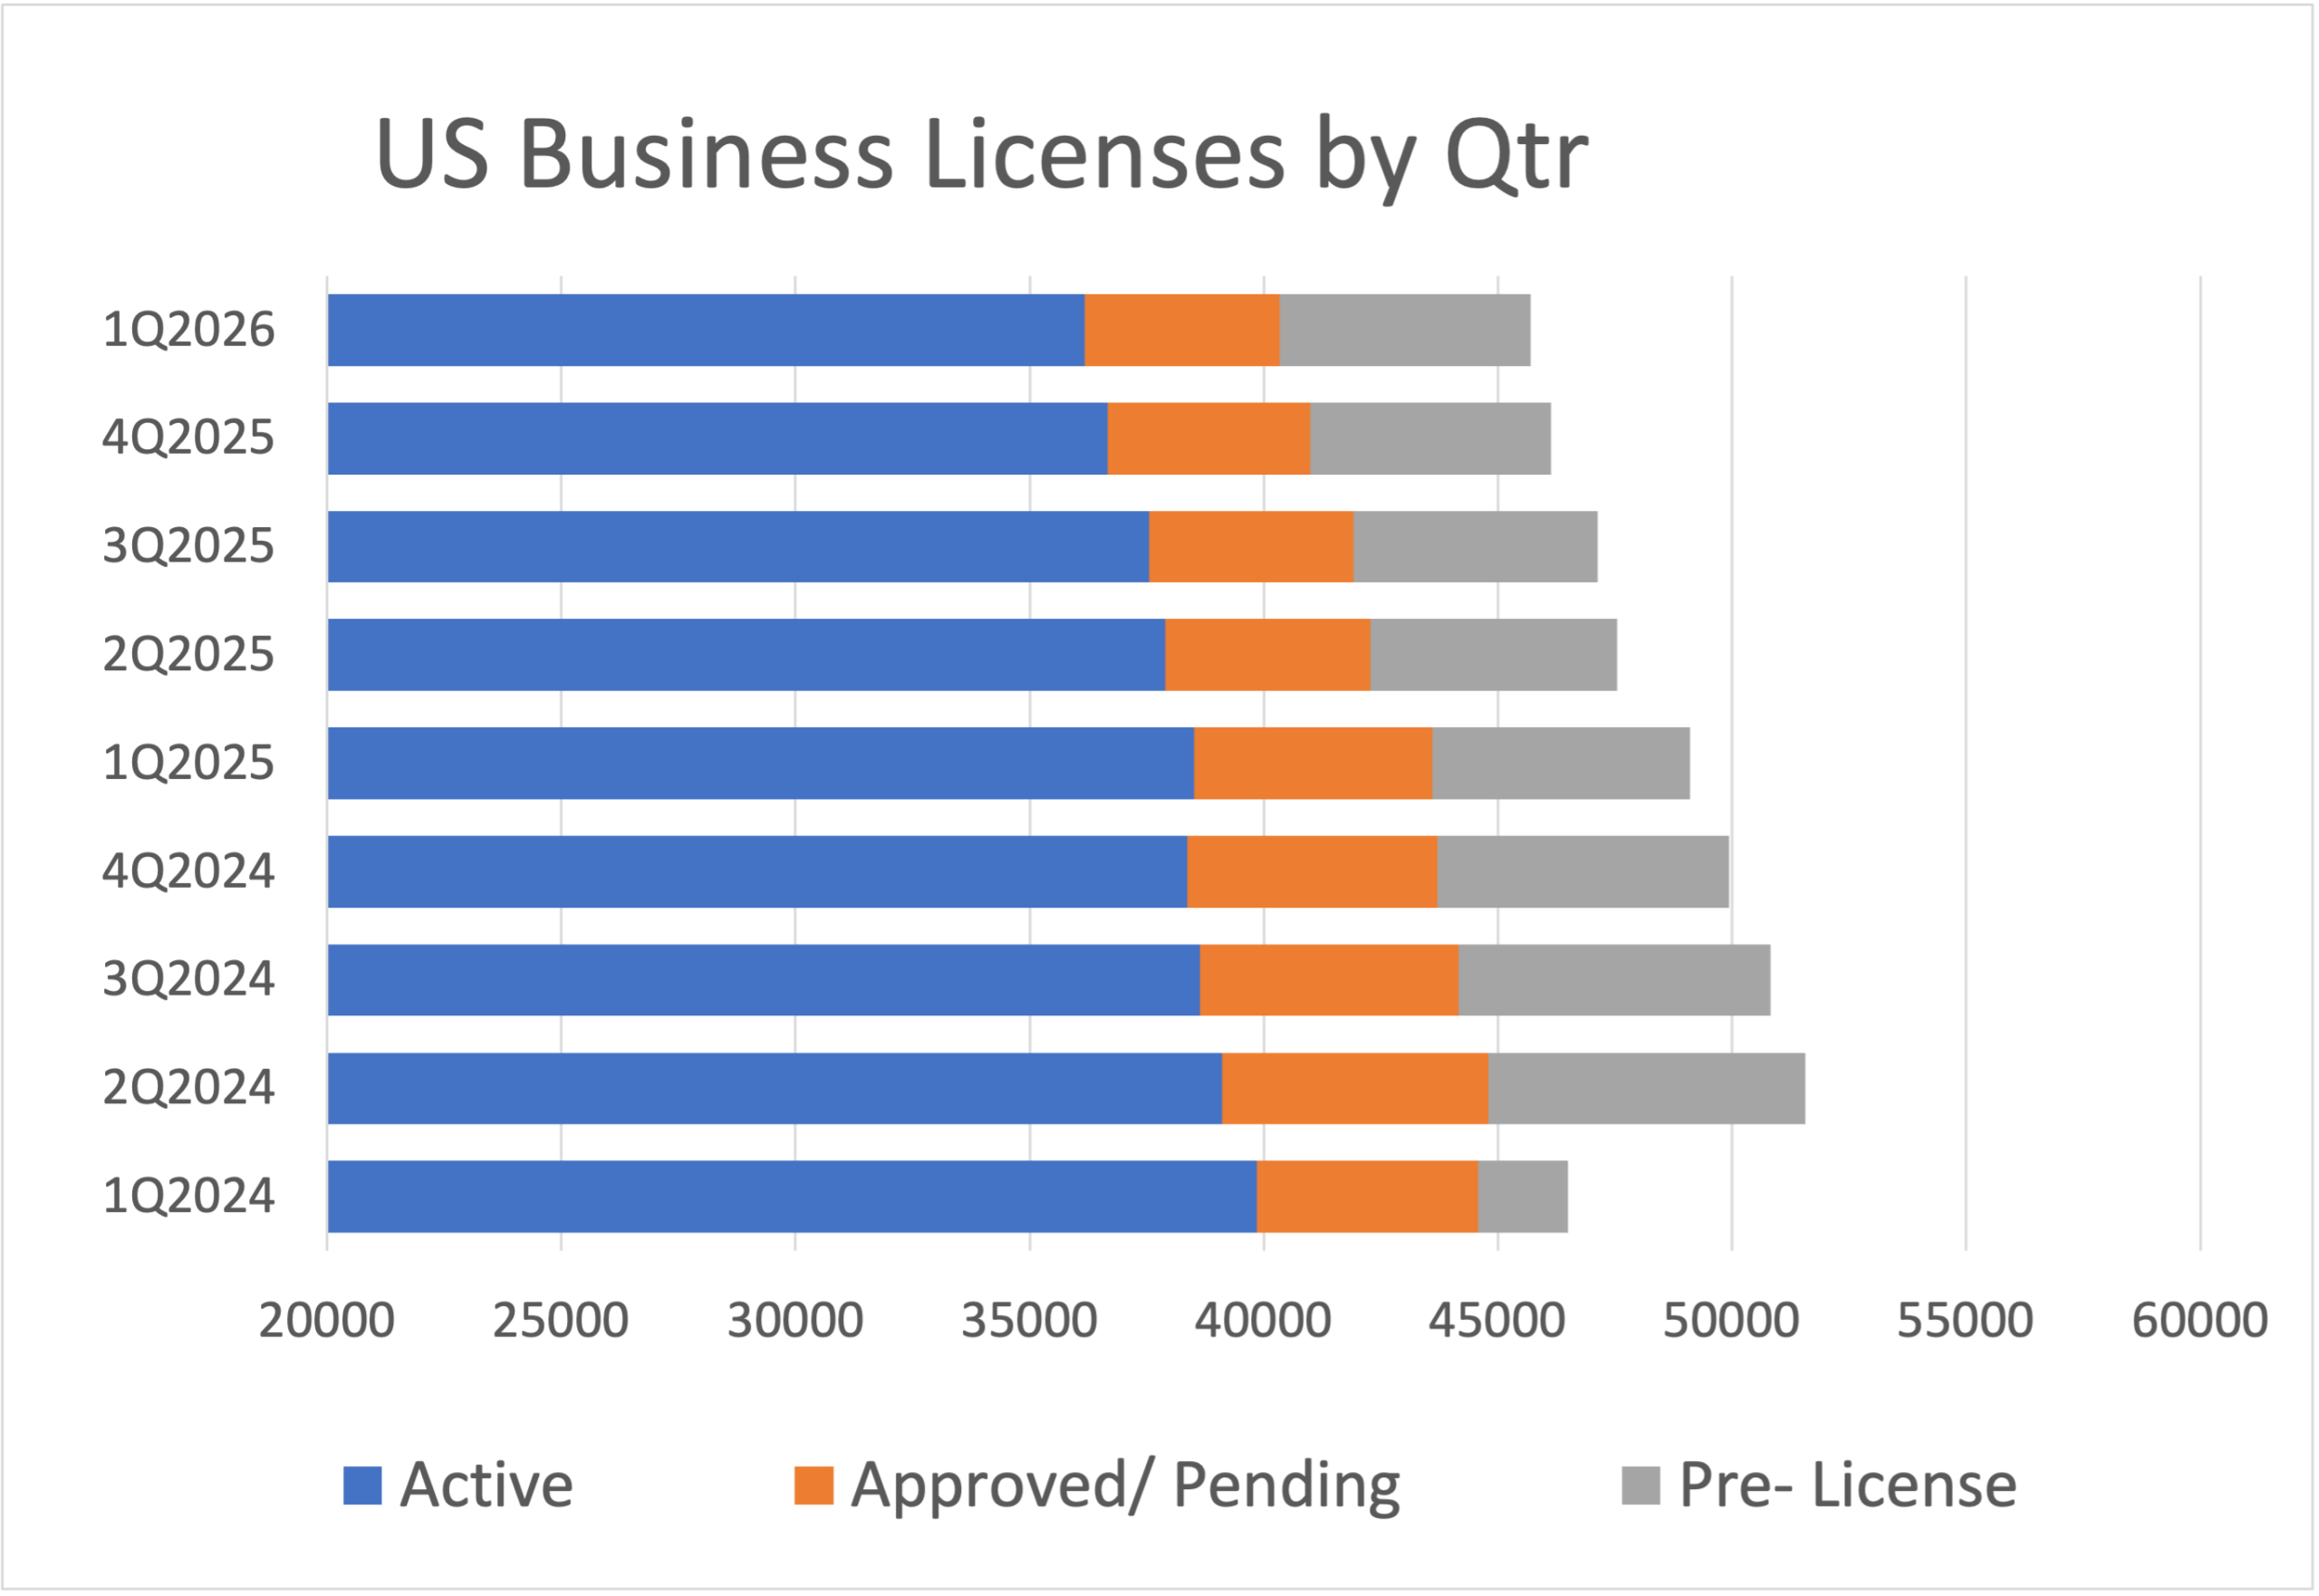 As of the end of March, total active U.S. cannabis business licenses fell by 1% to 36,169. This quarterly decline represents a continuation of a nearly unbroken three-year sequential decline first evidenced in the fourth quarter of 2022. Compared to the prior one-year period, active licenses were 6% lower. Over a six-month rolling period, total active licenses declined by 4%, and over the past two years, the U.S. market has seen a cumulative 9% drop in active licensed operators.
Approved and pending licenses—reflecting anticipated near-term growth across the country’s 48 regulated cannabis markets—fell more dramatically in the first quarter, dropping 4% to 4,175. This marked the seventh consecutive quarterly decline in new license approvals. The year-over-year comparison is steeper: the number of new licenses pending at the end of March represented an 18% drop from Q1 2025 levels. The decline was attributed in part to a large cohort of applications in New York slowly working its way through processing, reducing the pending queue.
Pre-licensing activity, defined as new license submissions under review, rose 4% to 5,352, reversing a five-quarter decline that began in the third quarter of 2024. This increase is largely attributable to Texas’ low-THC medical licensing rollout. Compared to the previous six-month period, pre-licensing totals were 3% higher, but they remained 3% lower than a year ago, primarily because of the large backlog of applicants under review in New York.
For the last six quarters, New York dominated pre-licensing totals, accounting for more than 85% of applications under review nationally, with 4,522 applicants awaiting approvals. Despite this, the state processed a net total of only 46 applications during the quarter—just 1% of the application backlog, which has persisted more or less unchanged for more than a year.
Canadian Market
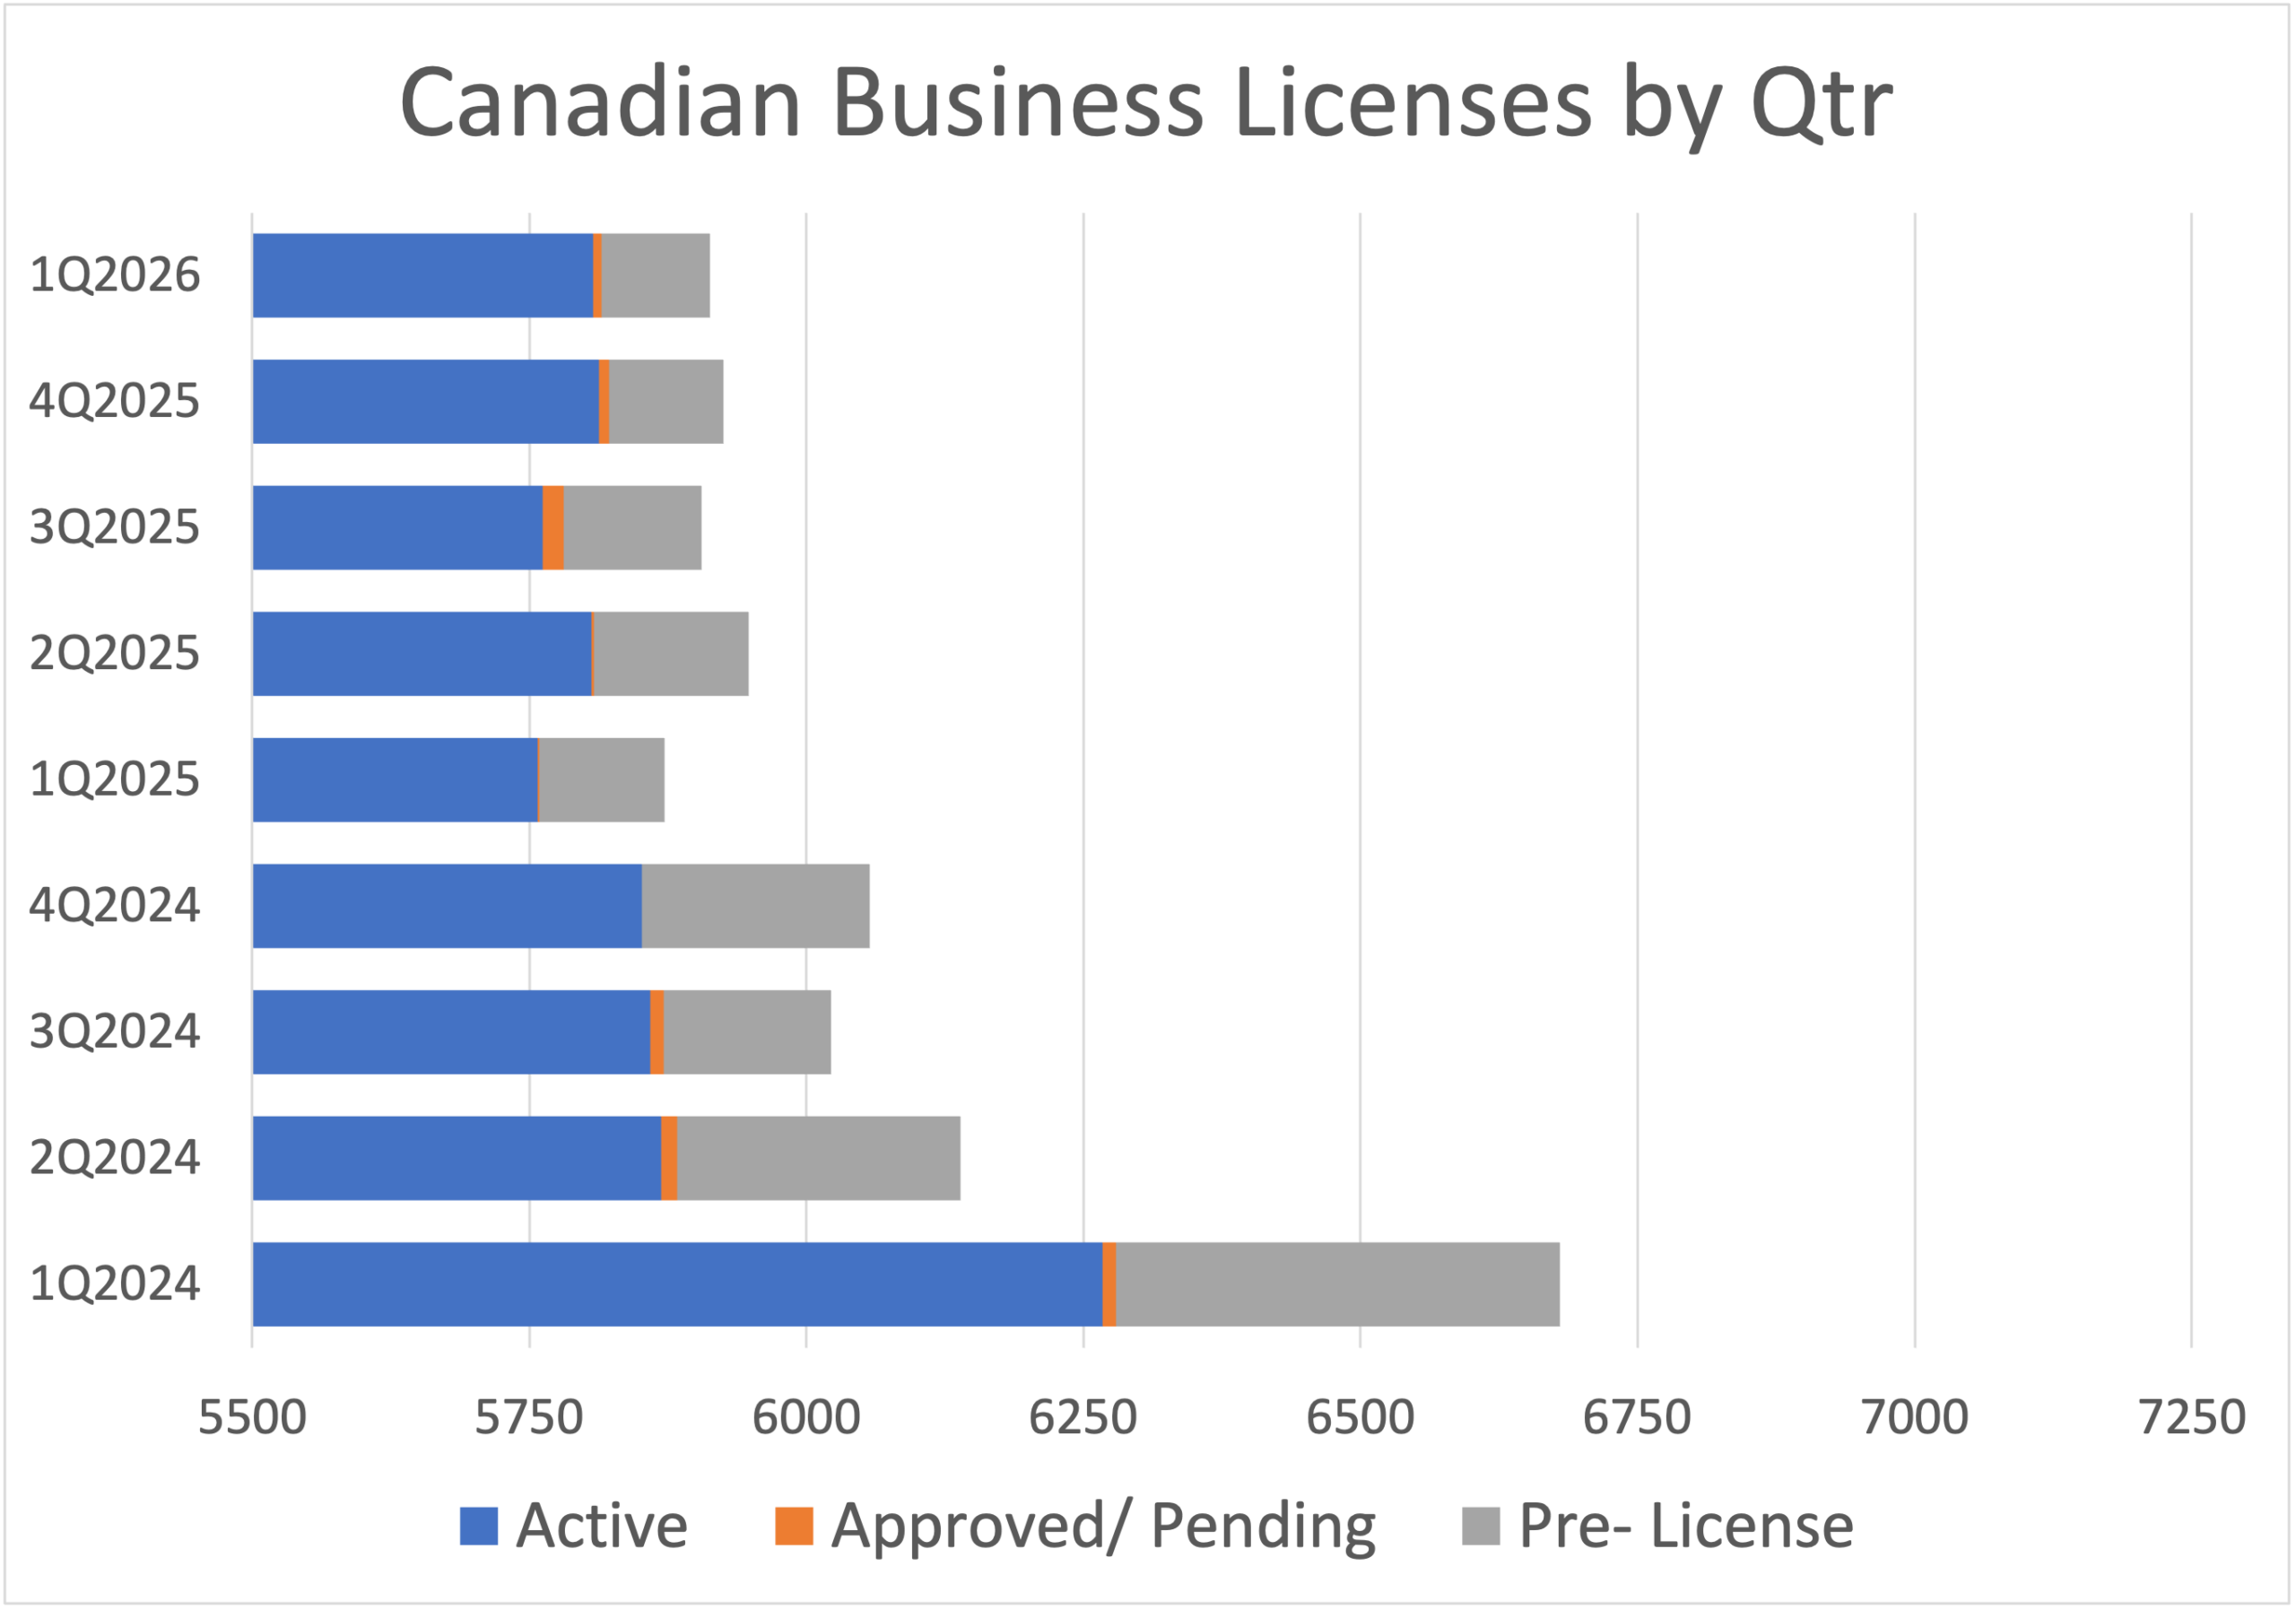 Active Canadian business licensing totals were flat in the first quarter, continuing a trend observed for more than a year. There were 5,807 active operating licensees in Q1 2026, representing a net loss of just five licensees. The country’s nationally regulated cannabis market has hovered in the 5,800-operator range for the preceding six quarters.

This ongoing stability has established a floor on the number of active operators in the Canadian market, capping a two-year decline of 7% in active licensees. The market has also experienced a dearth of newly licensed market entrants, a trend that persisted into Q1 2026, with only eight applications approved or pending and 98 new license applications in review. The number of applications in review is 13% lower than a year ago and 76% lower than two years ago.
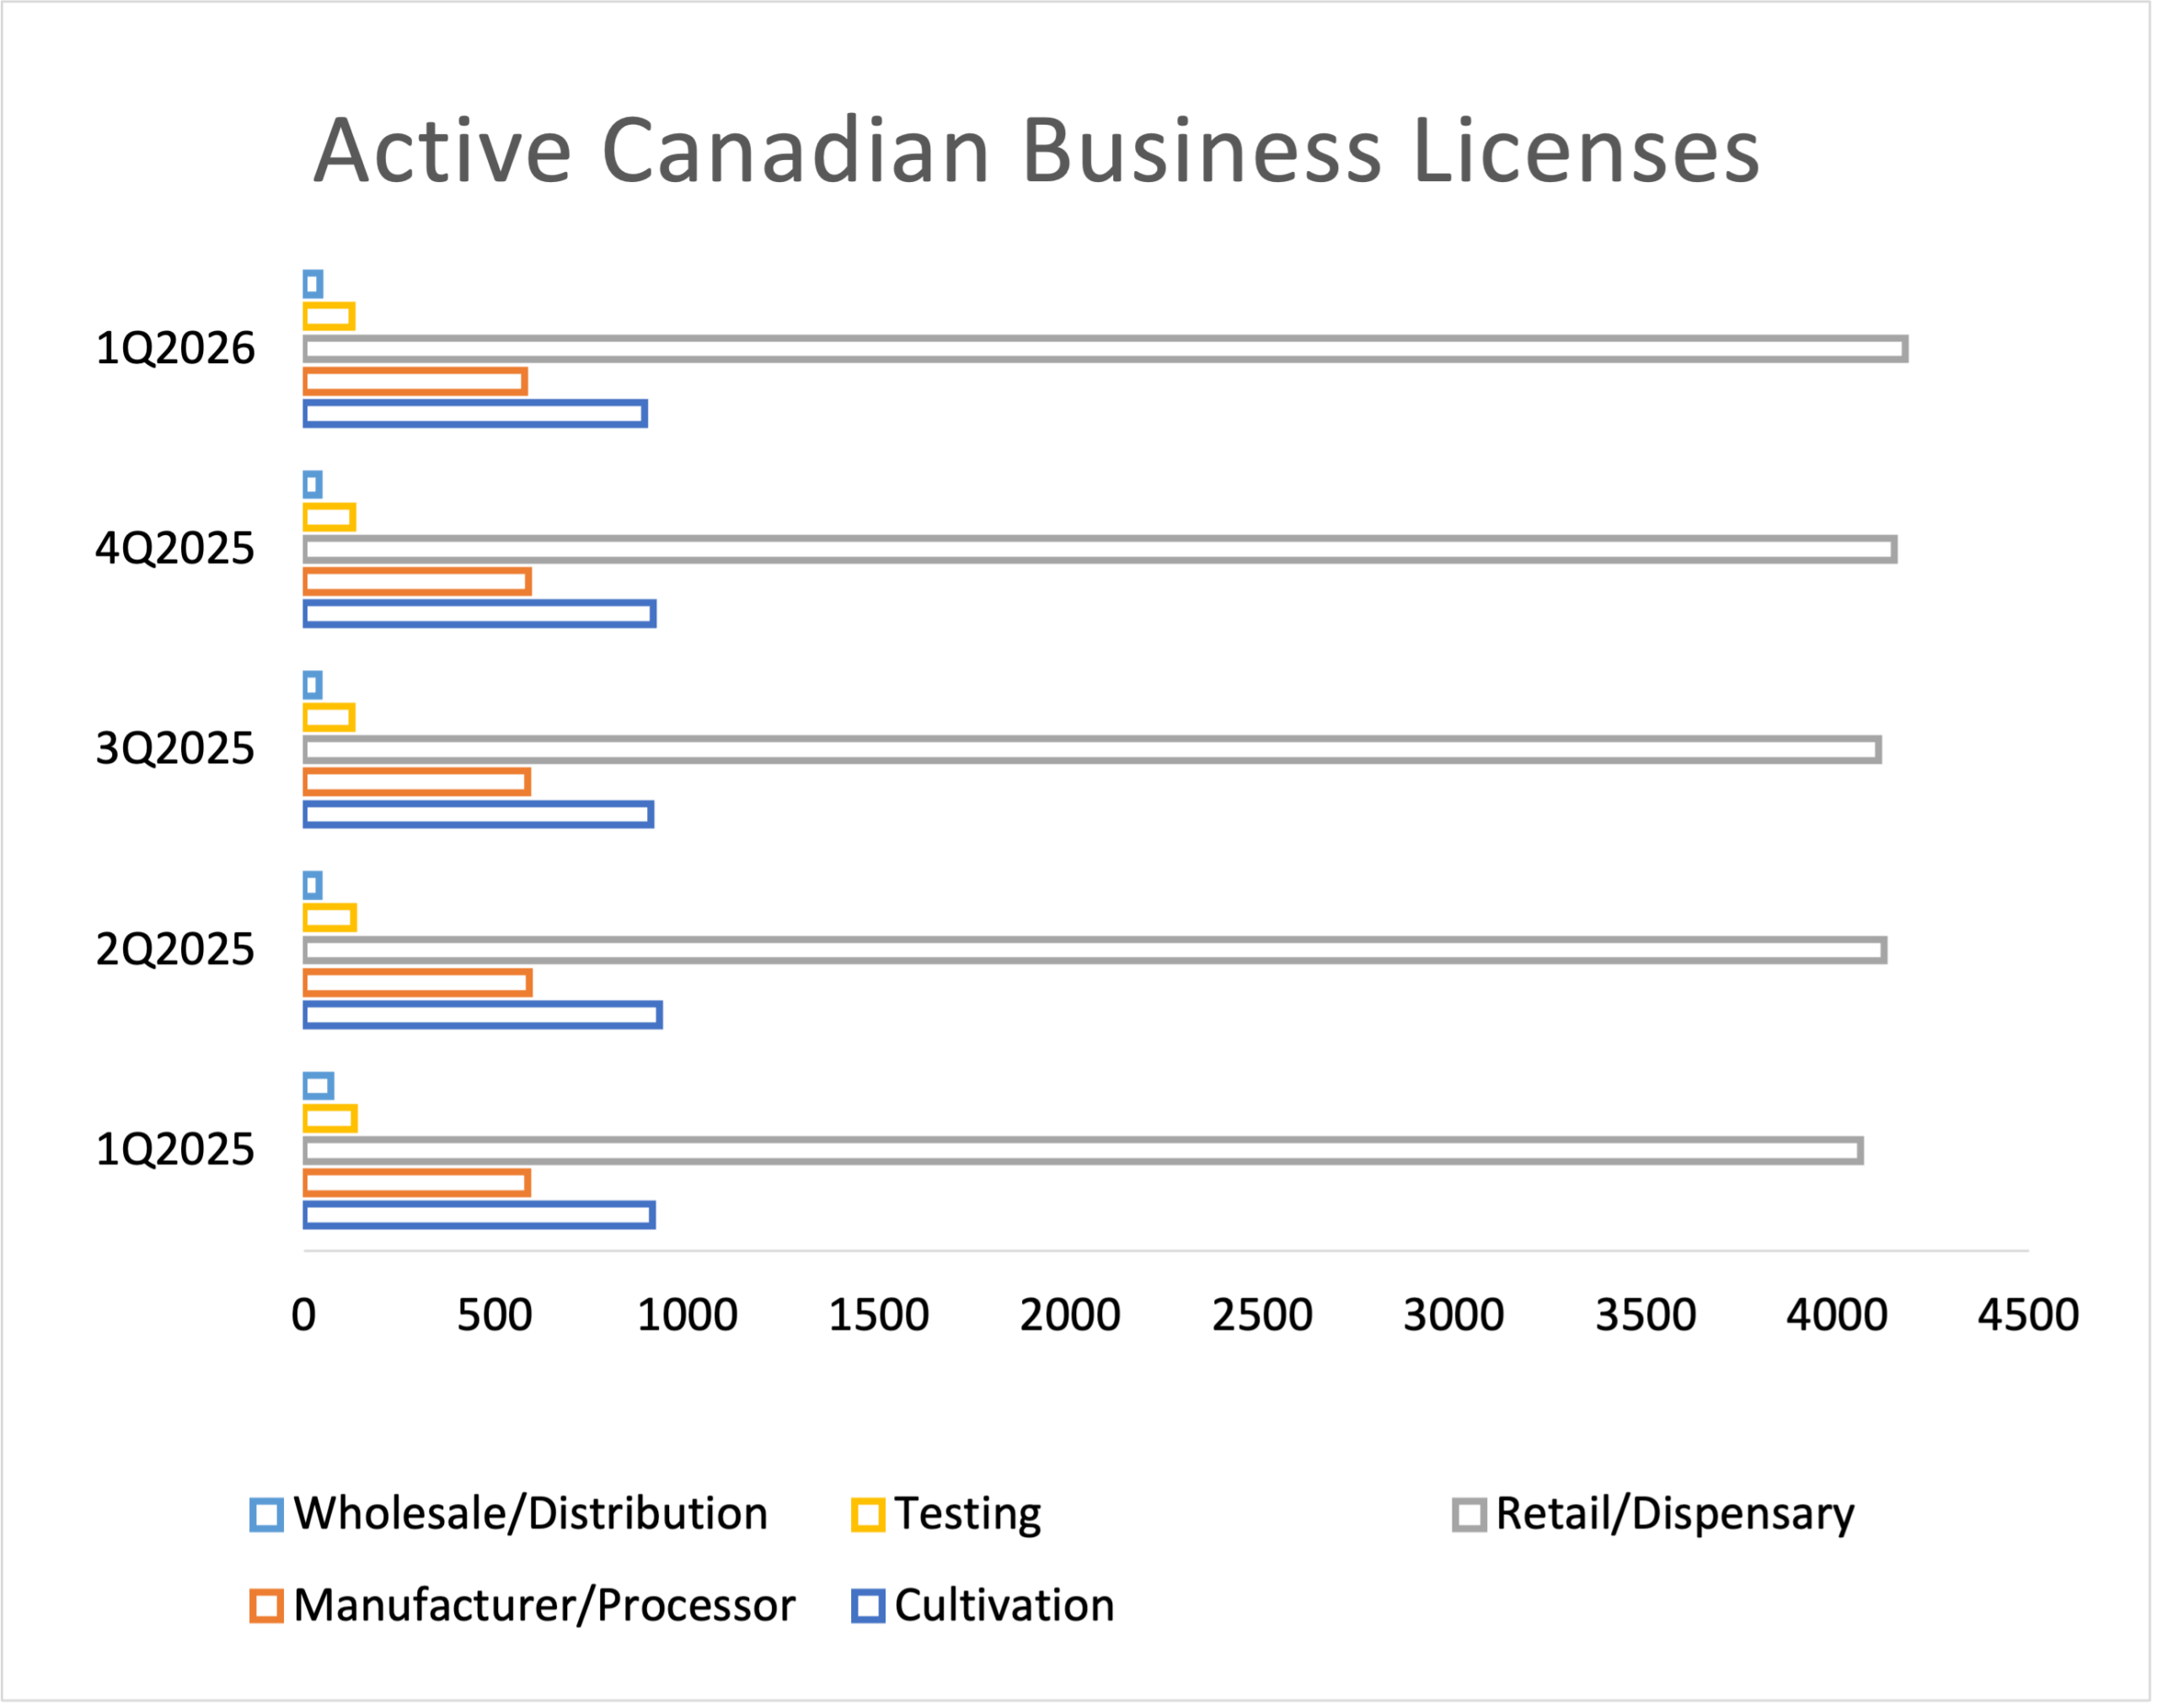 No Canadian license type experienced a positive or negative variance of more than 2% from the end of 2025. Wholesaler/distributors added 2% for a total of 41 active operators, while testing facilities, manufacturer/processors, and cultivators each lost 2% of their active licensees.
Retail dispensary licenses remained the largest license type in Canada, with just over 4,176 active permits, a 1% increase in a sector that experienced no measurable growth over the past two years. Cultivation licenses were the second largest, ending the quarter with 889 active licensees, followed by manufacturer/processor licenses with 576 active licensees.
U.S. Major License Types
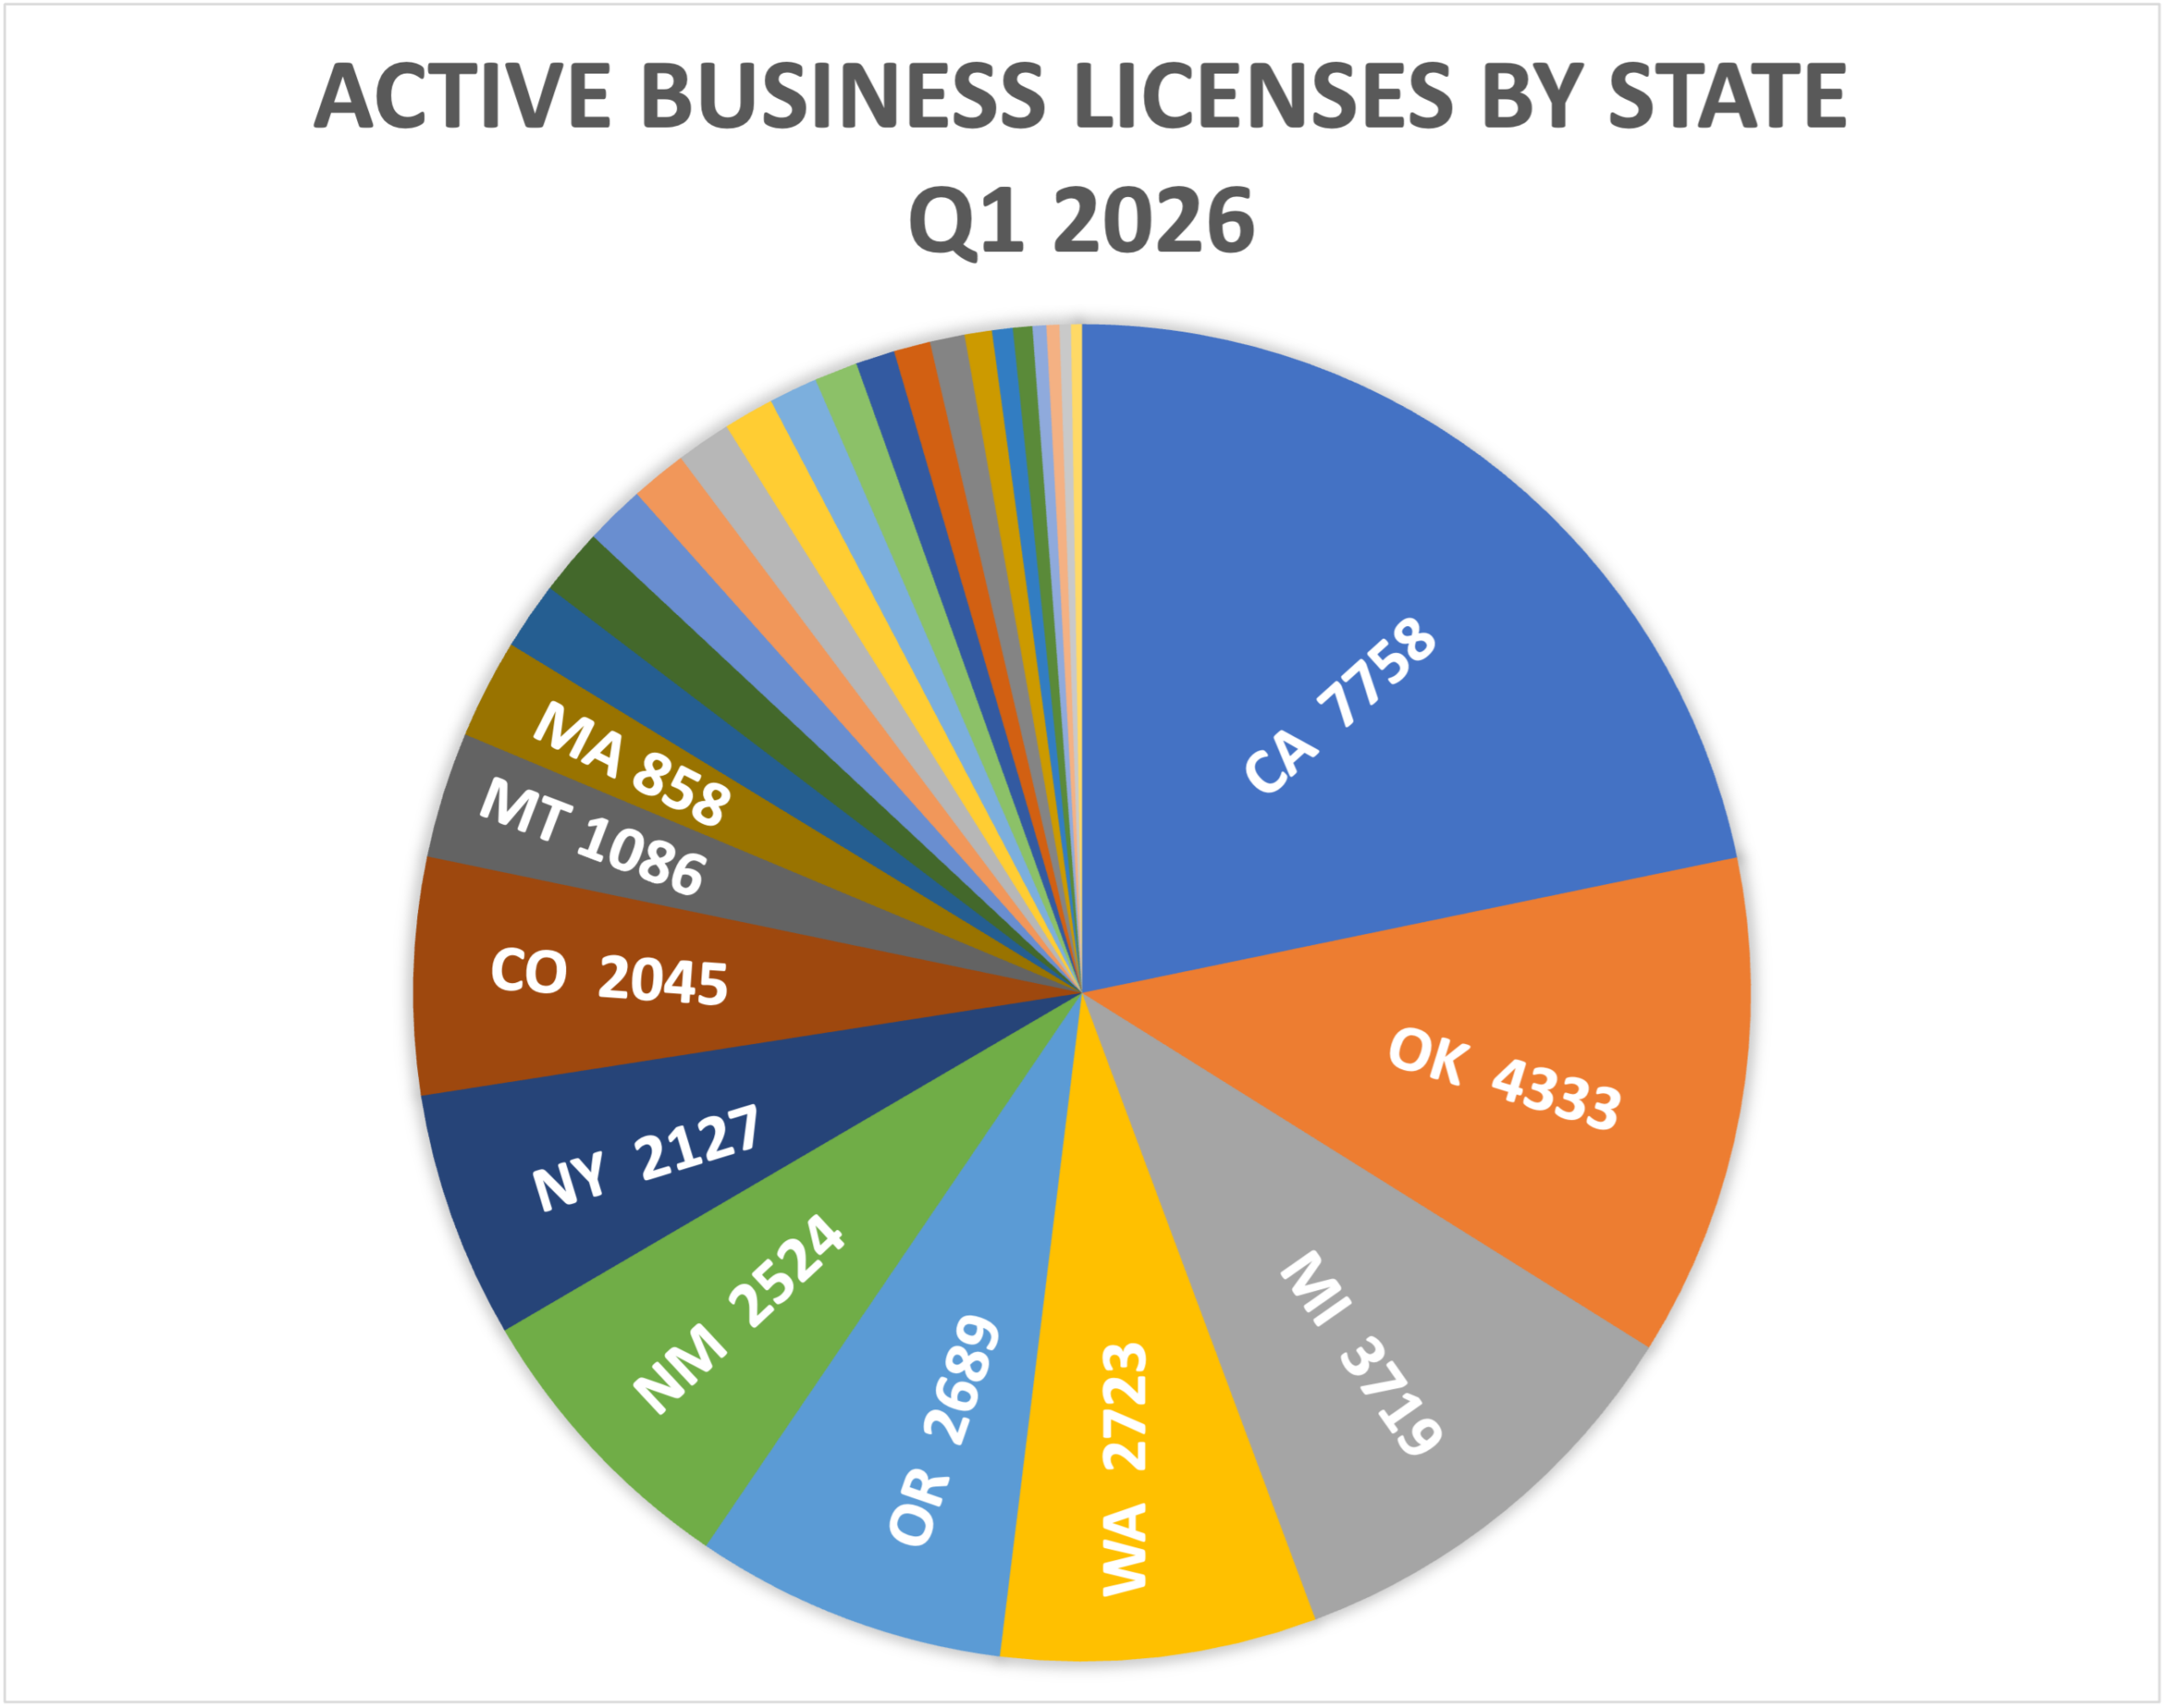
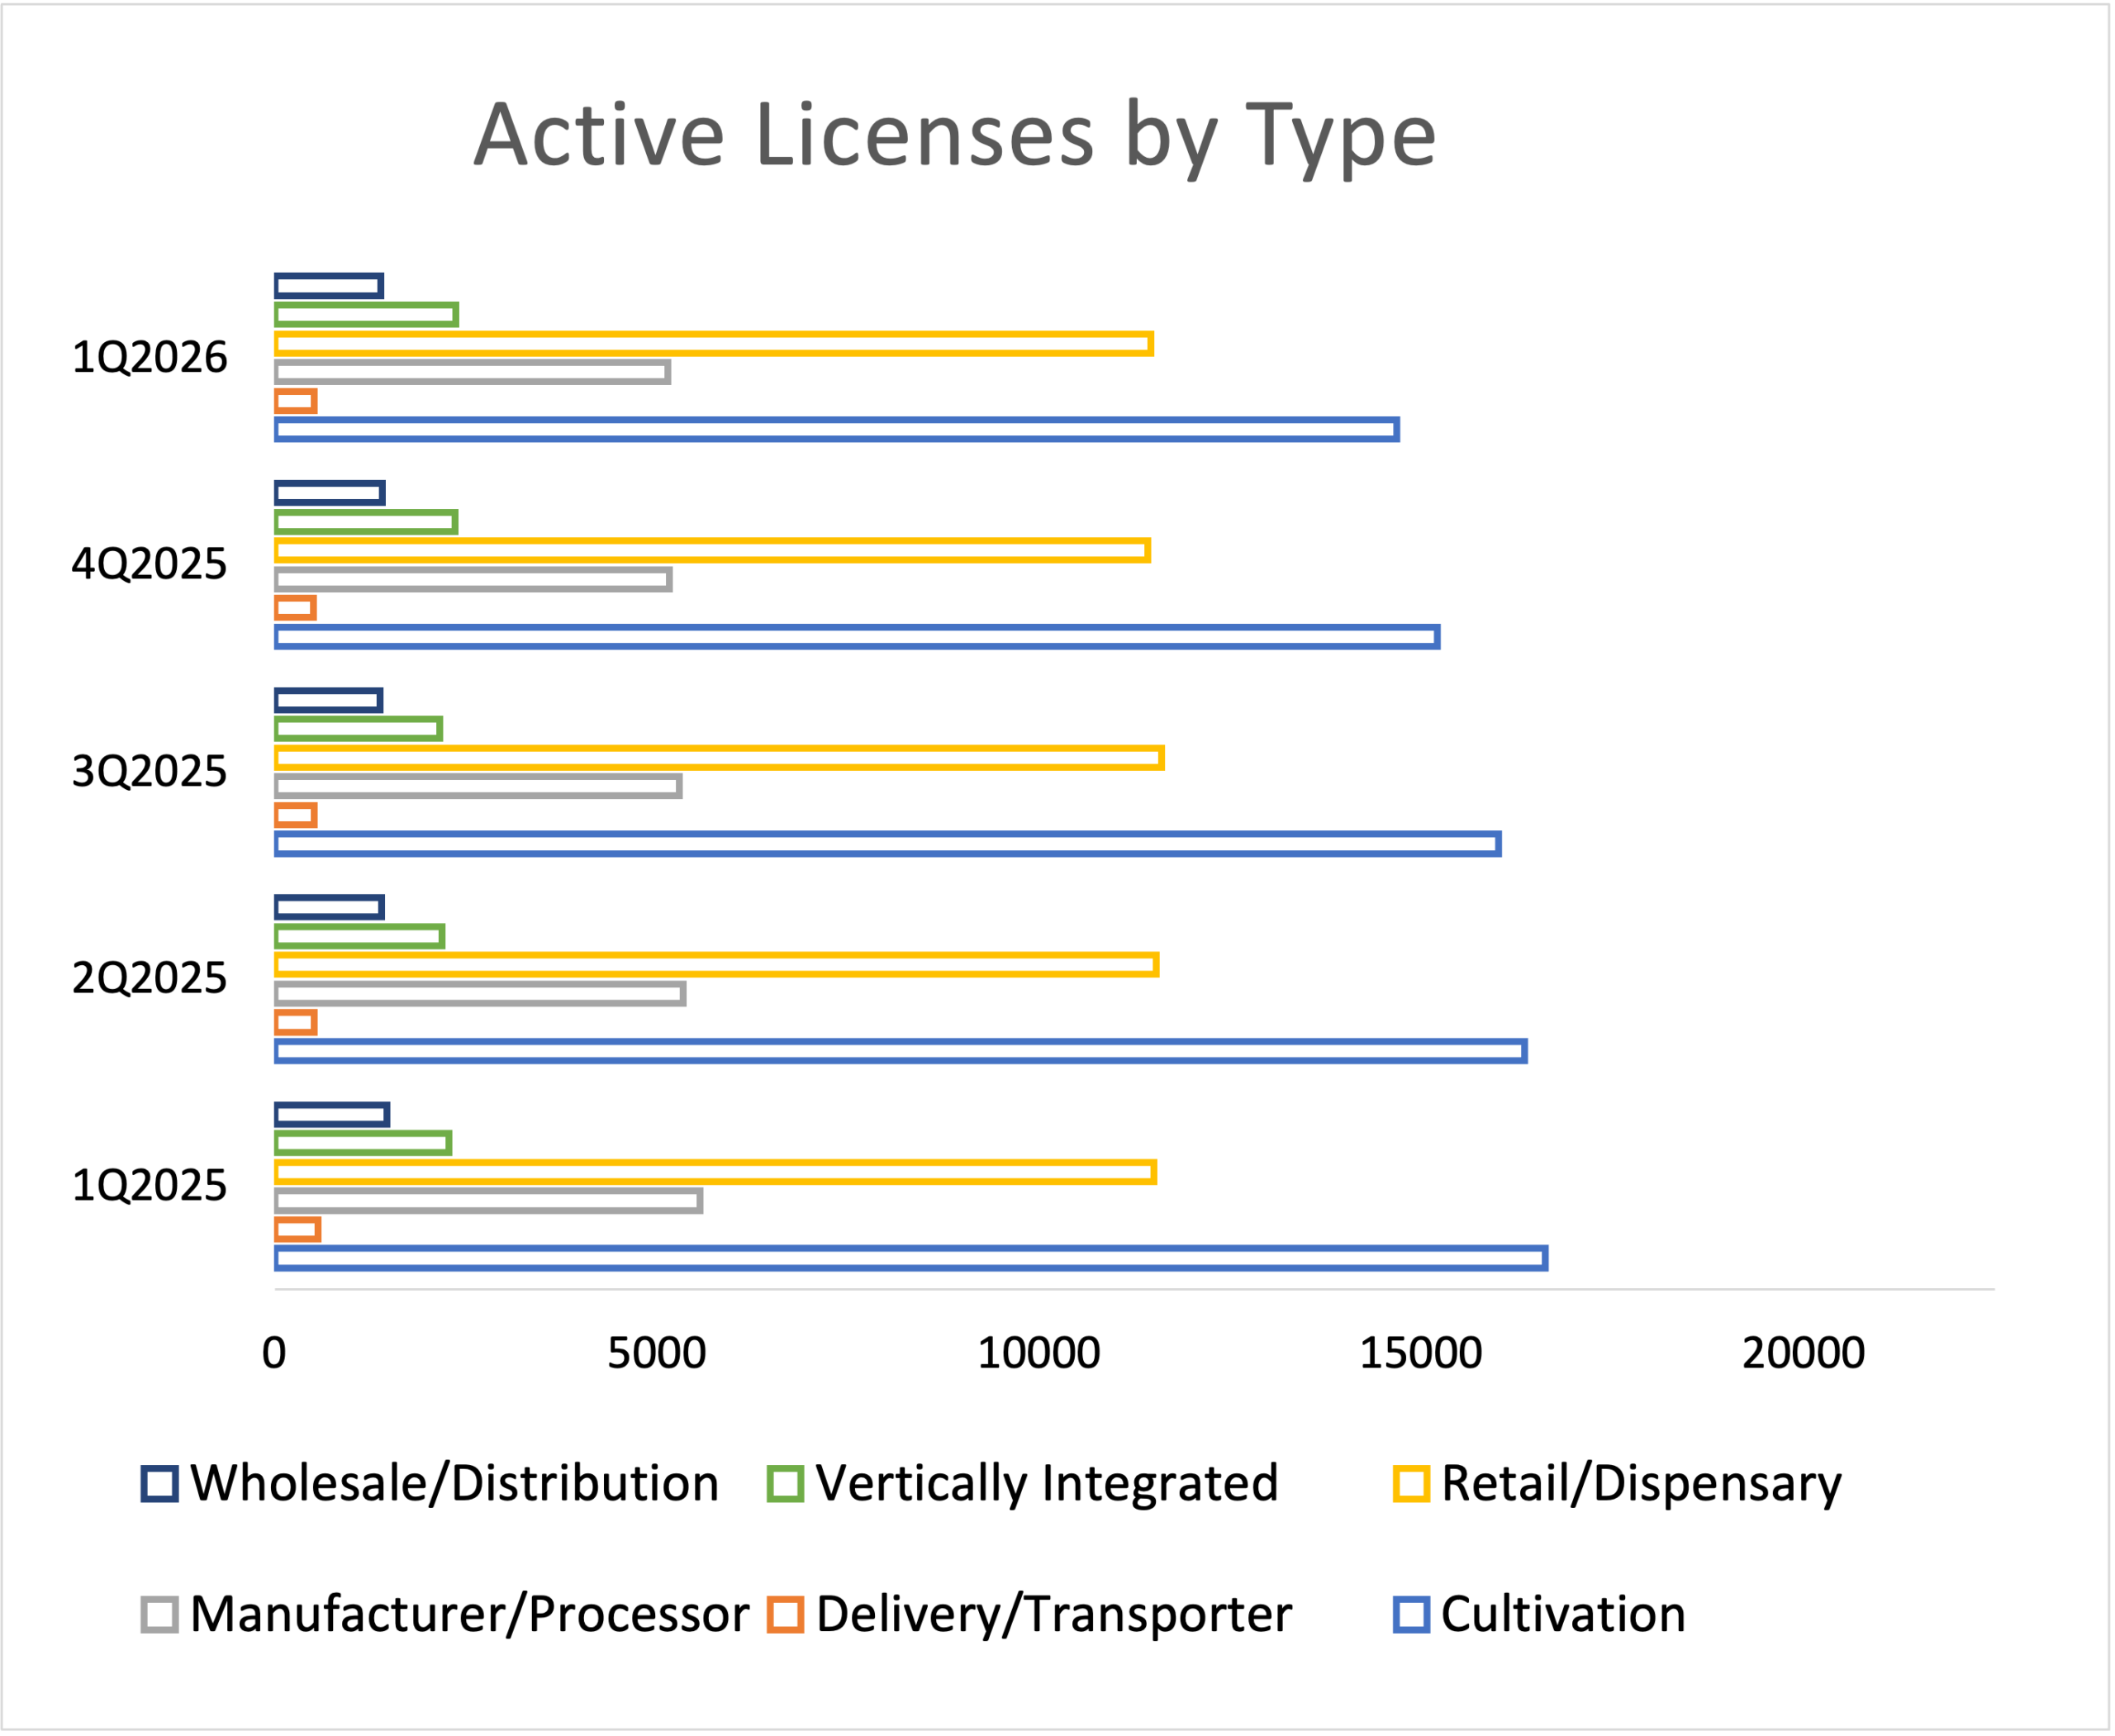 Cultivation and retail/dispensary licenses together comprised the largest cohort of active U.S. licenses, representing 72% of total active licenses in the first quarter. At the end of March, there were 14,671 active cultivation licenses, a decline of 4%, and 11,458 active retail/dispensary licenses, unchanged from the prior quarter. Seven states accounted for 75% of all active cultivation and retail licenses in the U.S.: California, Oklahoma, Michigan, Oregon, Washington, New Mexico, and Colorado.
Manufacturer/processor licenses were the third largest license type, unchanged for the quarter with 5,143 active licenses. Wholesale/distribution licenses followed with 1,384 active licenses, a 1% decrease.
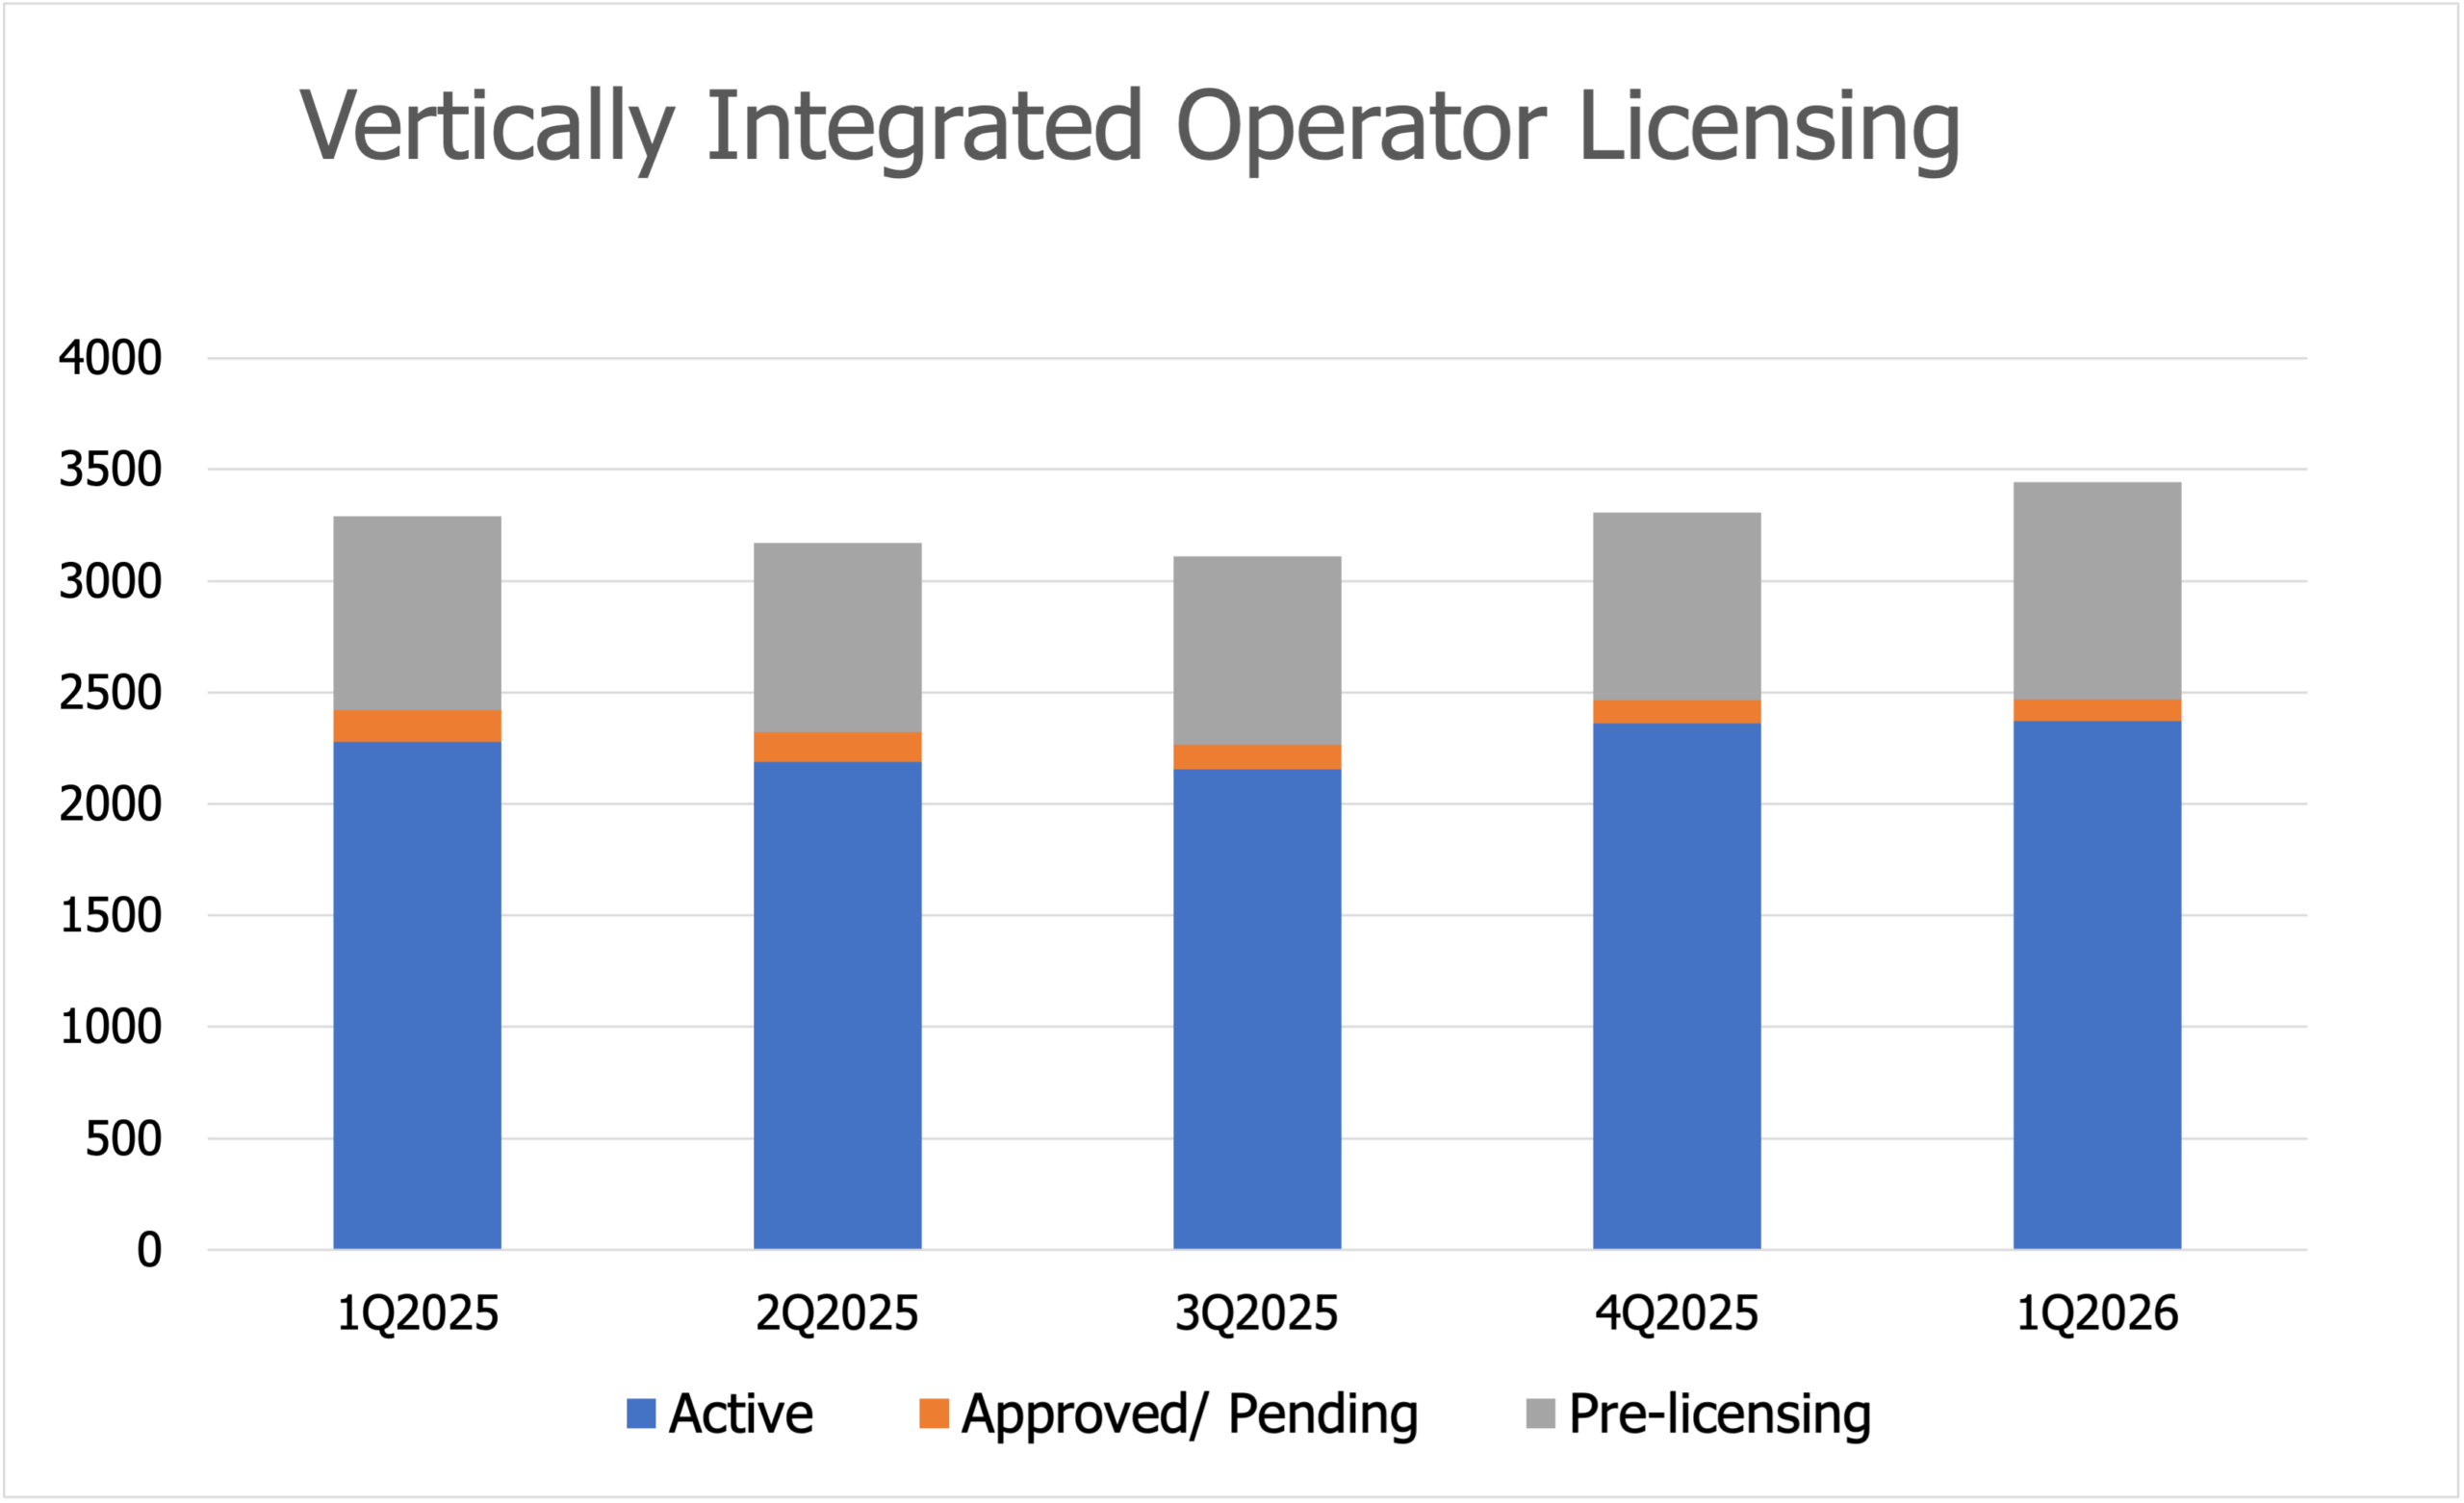 Vertically integrated operators, which had shown the greatest growth of all operator types over the past two years, leveled off in the first quarter, adding less than 1% to end March with 2,372 active licensees. Much of the prior year’s growth in vertical operators occurred in New Mexico, resulting from a one-time recharacterization of existing licensees rather than organic growth. Nearly 600 operators holding multiple licenses were recharacterized as master vertical licensees with sub-licenses for each permitted activity. New Mexico ended the quarter with 916 active vertically integrated operators, the most of any state market.
Looking forward, the vertically integrated segment will likely remain the fourth largest operator category as New York slowly works through more than 800 outstanding applications for new vertical operations. New York ended the quarter with 352 active vertical operators.
Approved & Pending Permits by Type
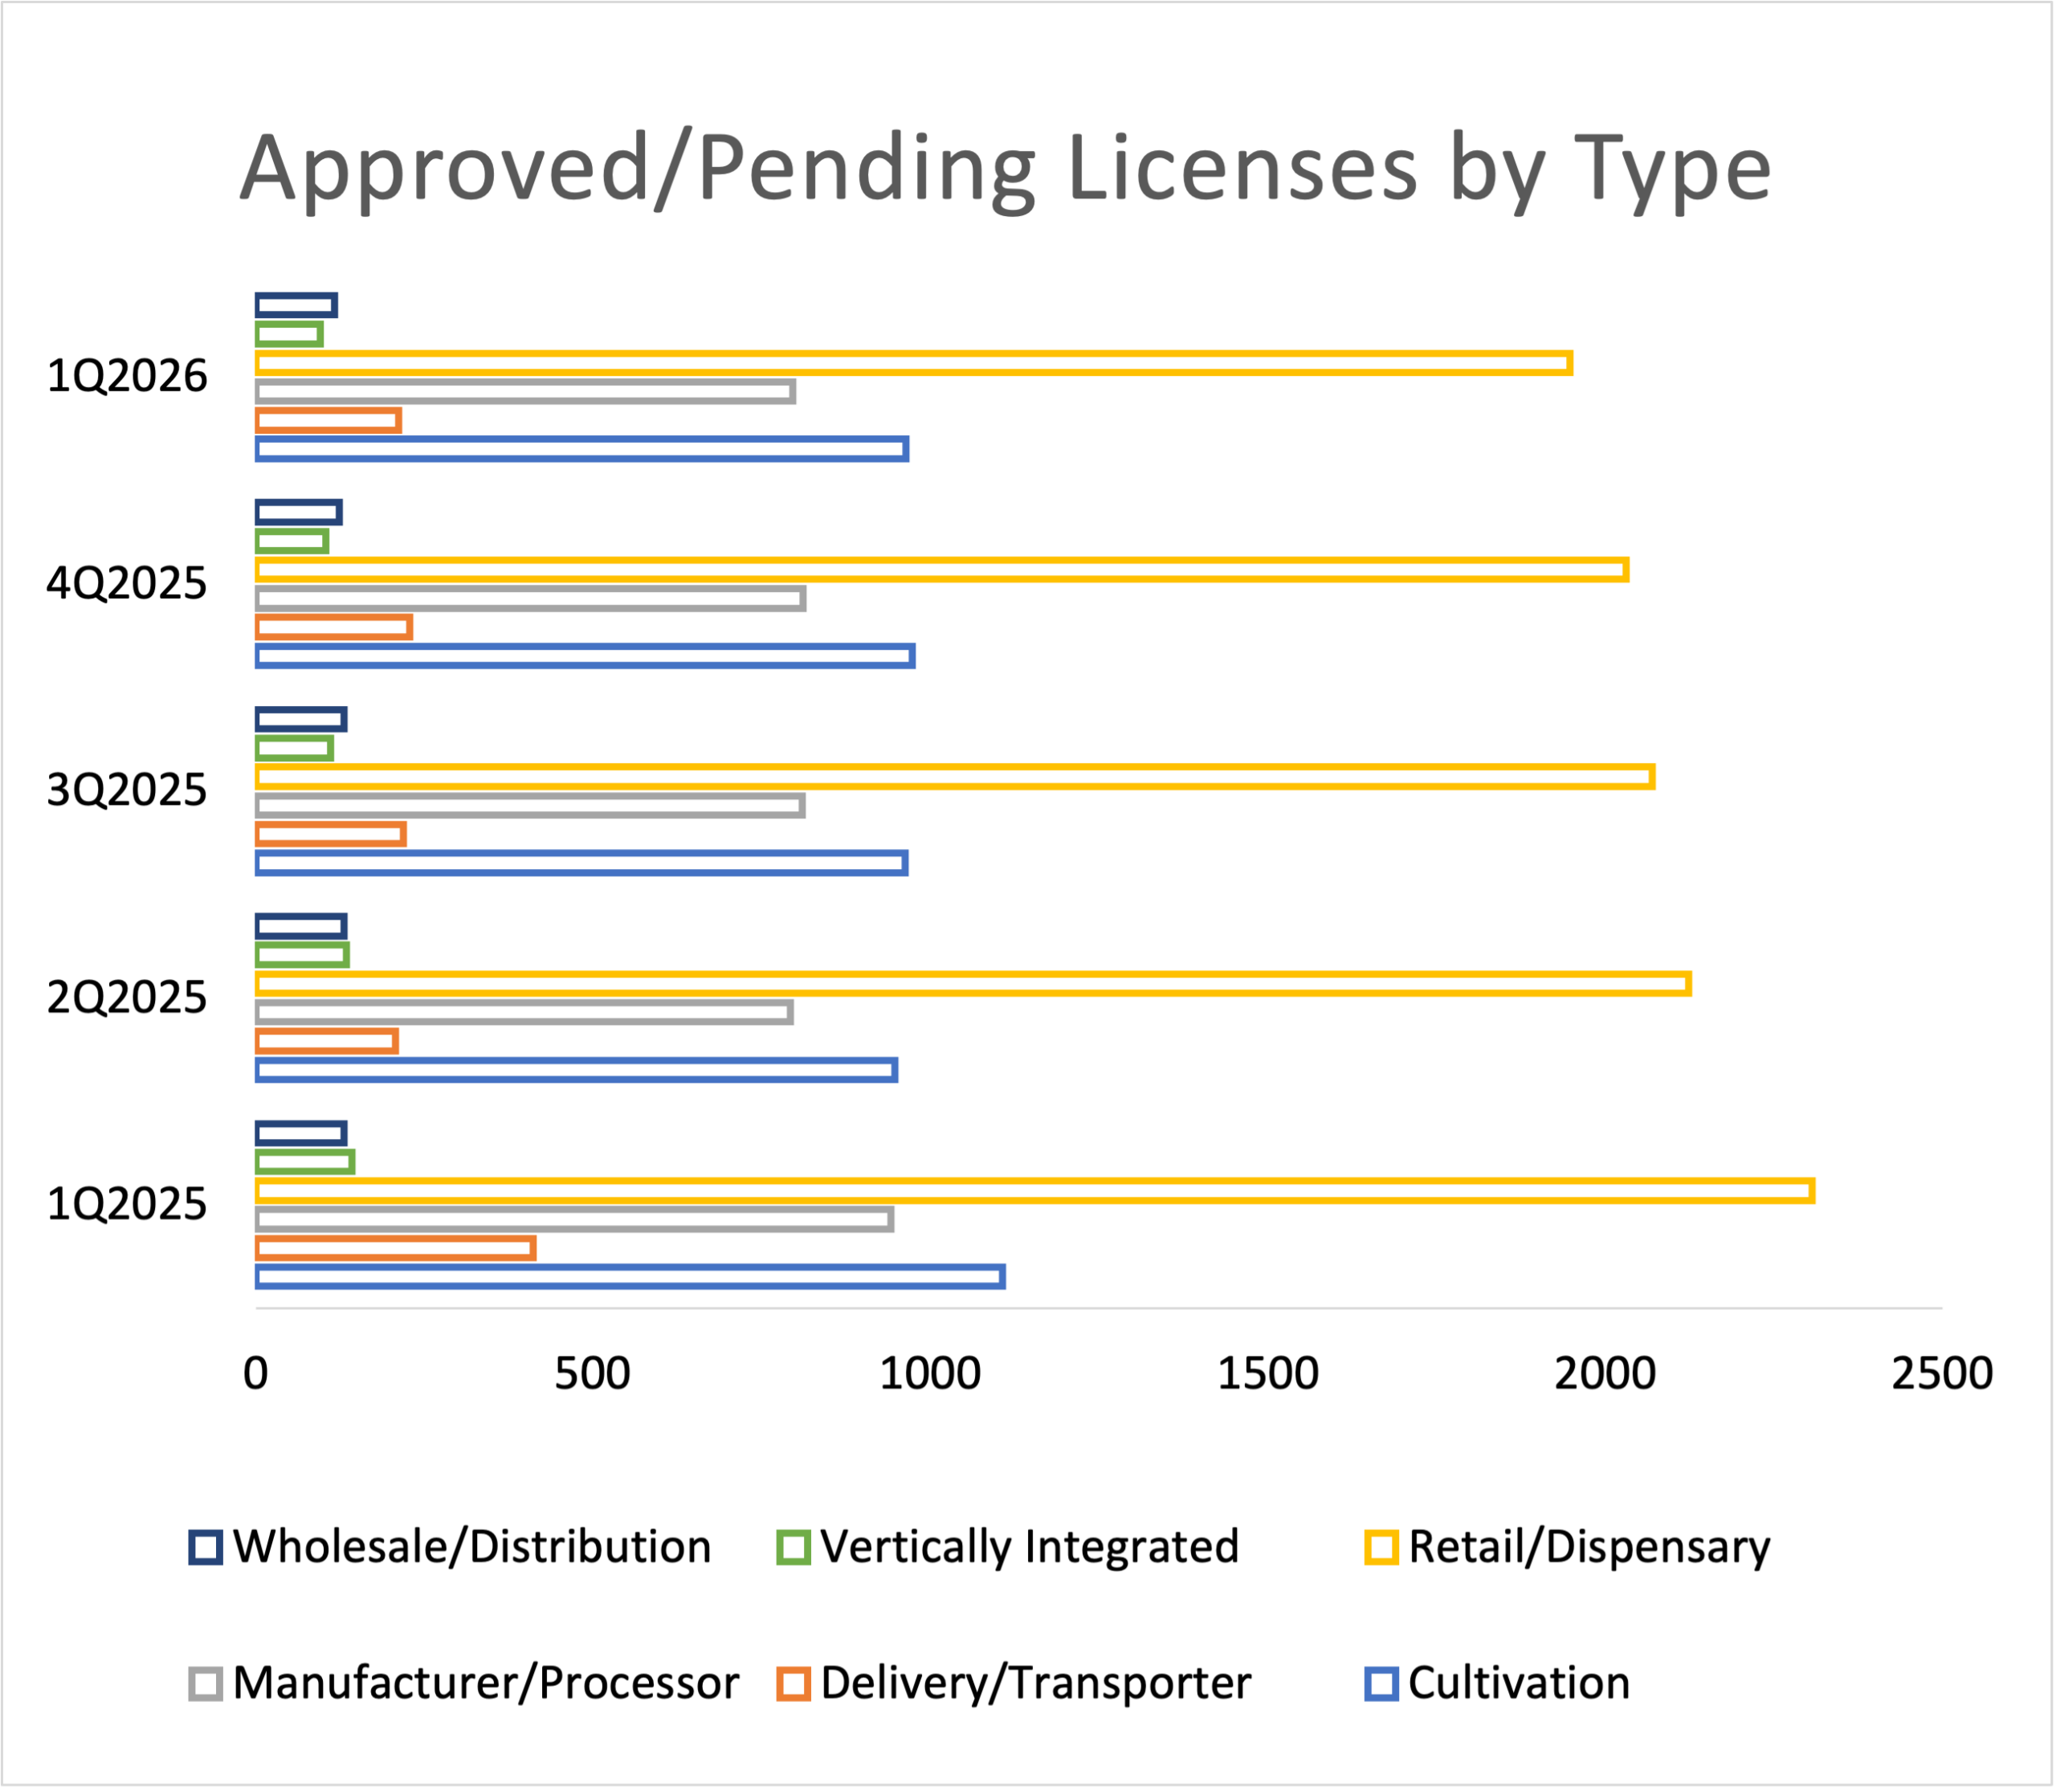 Approved and pending permit activity declined across all major license categories in the first quarter. The 4% overall decline marked the seventh consecutive quarterly drop in new business license approvals after peaking in the first half of 2024. In aggregate, new approvals were down 18% from a year ago.
Cultivators ended the quarter with 963 approved/pending licenses, a 1% decrease and 13% lower than a year ago. Cultivation permit approval activity is down 20% overall in the past two years, reflecting production consolidation in larger established markets like California, Colorado, and Oklahoma.
Retail operators ended the quarter with another 2% drop to 1,947 newly approved permits, marking a two-year low in newly licensed retailers nationally. Rationalization pressures in established retail markets were muted by license growth in newly opened states, primarily from Ohio’s adult-use market (one year old) and the ongoing rollout of adult-use retail in New York. Nonetheless, overall trends suggest sluggish store growth in aggregate for cannabis retailers going forward.
Delivery/transporter licenses fell 7% to 211 operators approved and pending at the end of the quarter. Pending manufacturer/processor licensing declined 2% in the first quarter and remains 15% lower than a year ago.
New Application Submissions
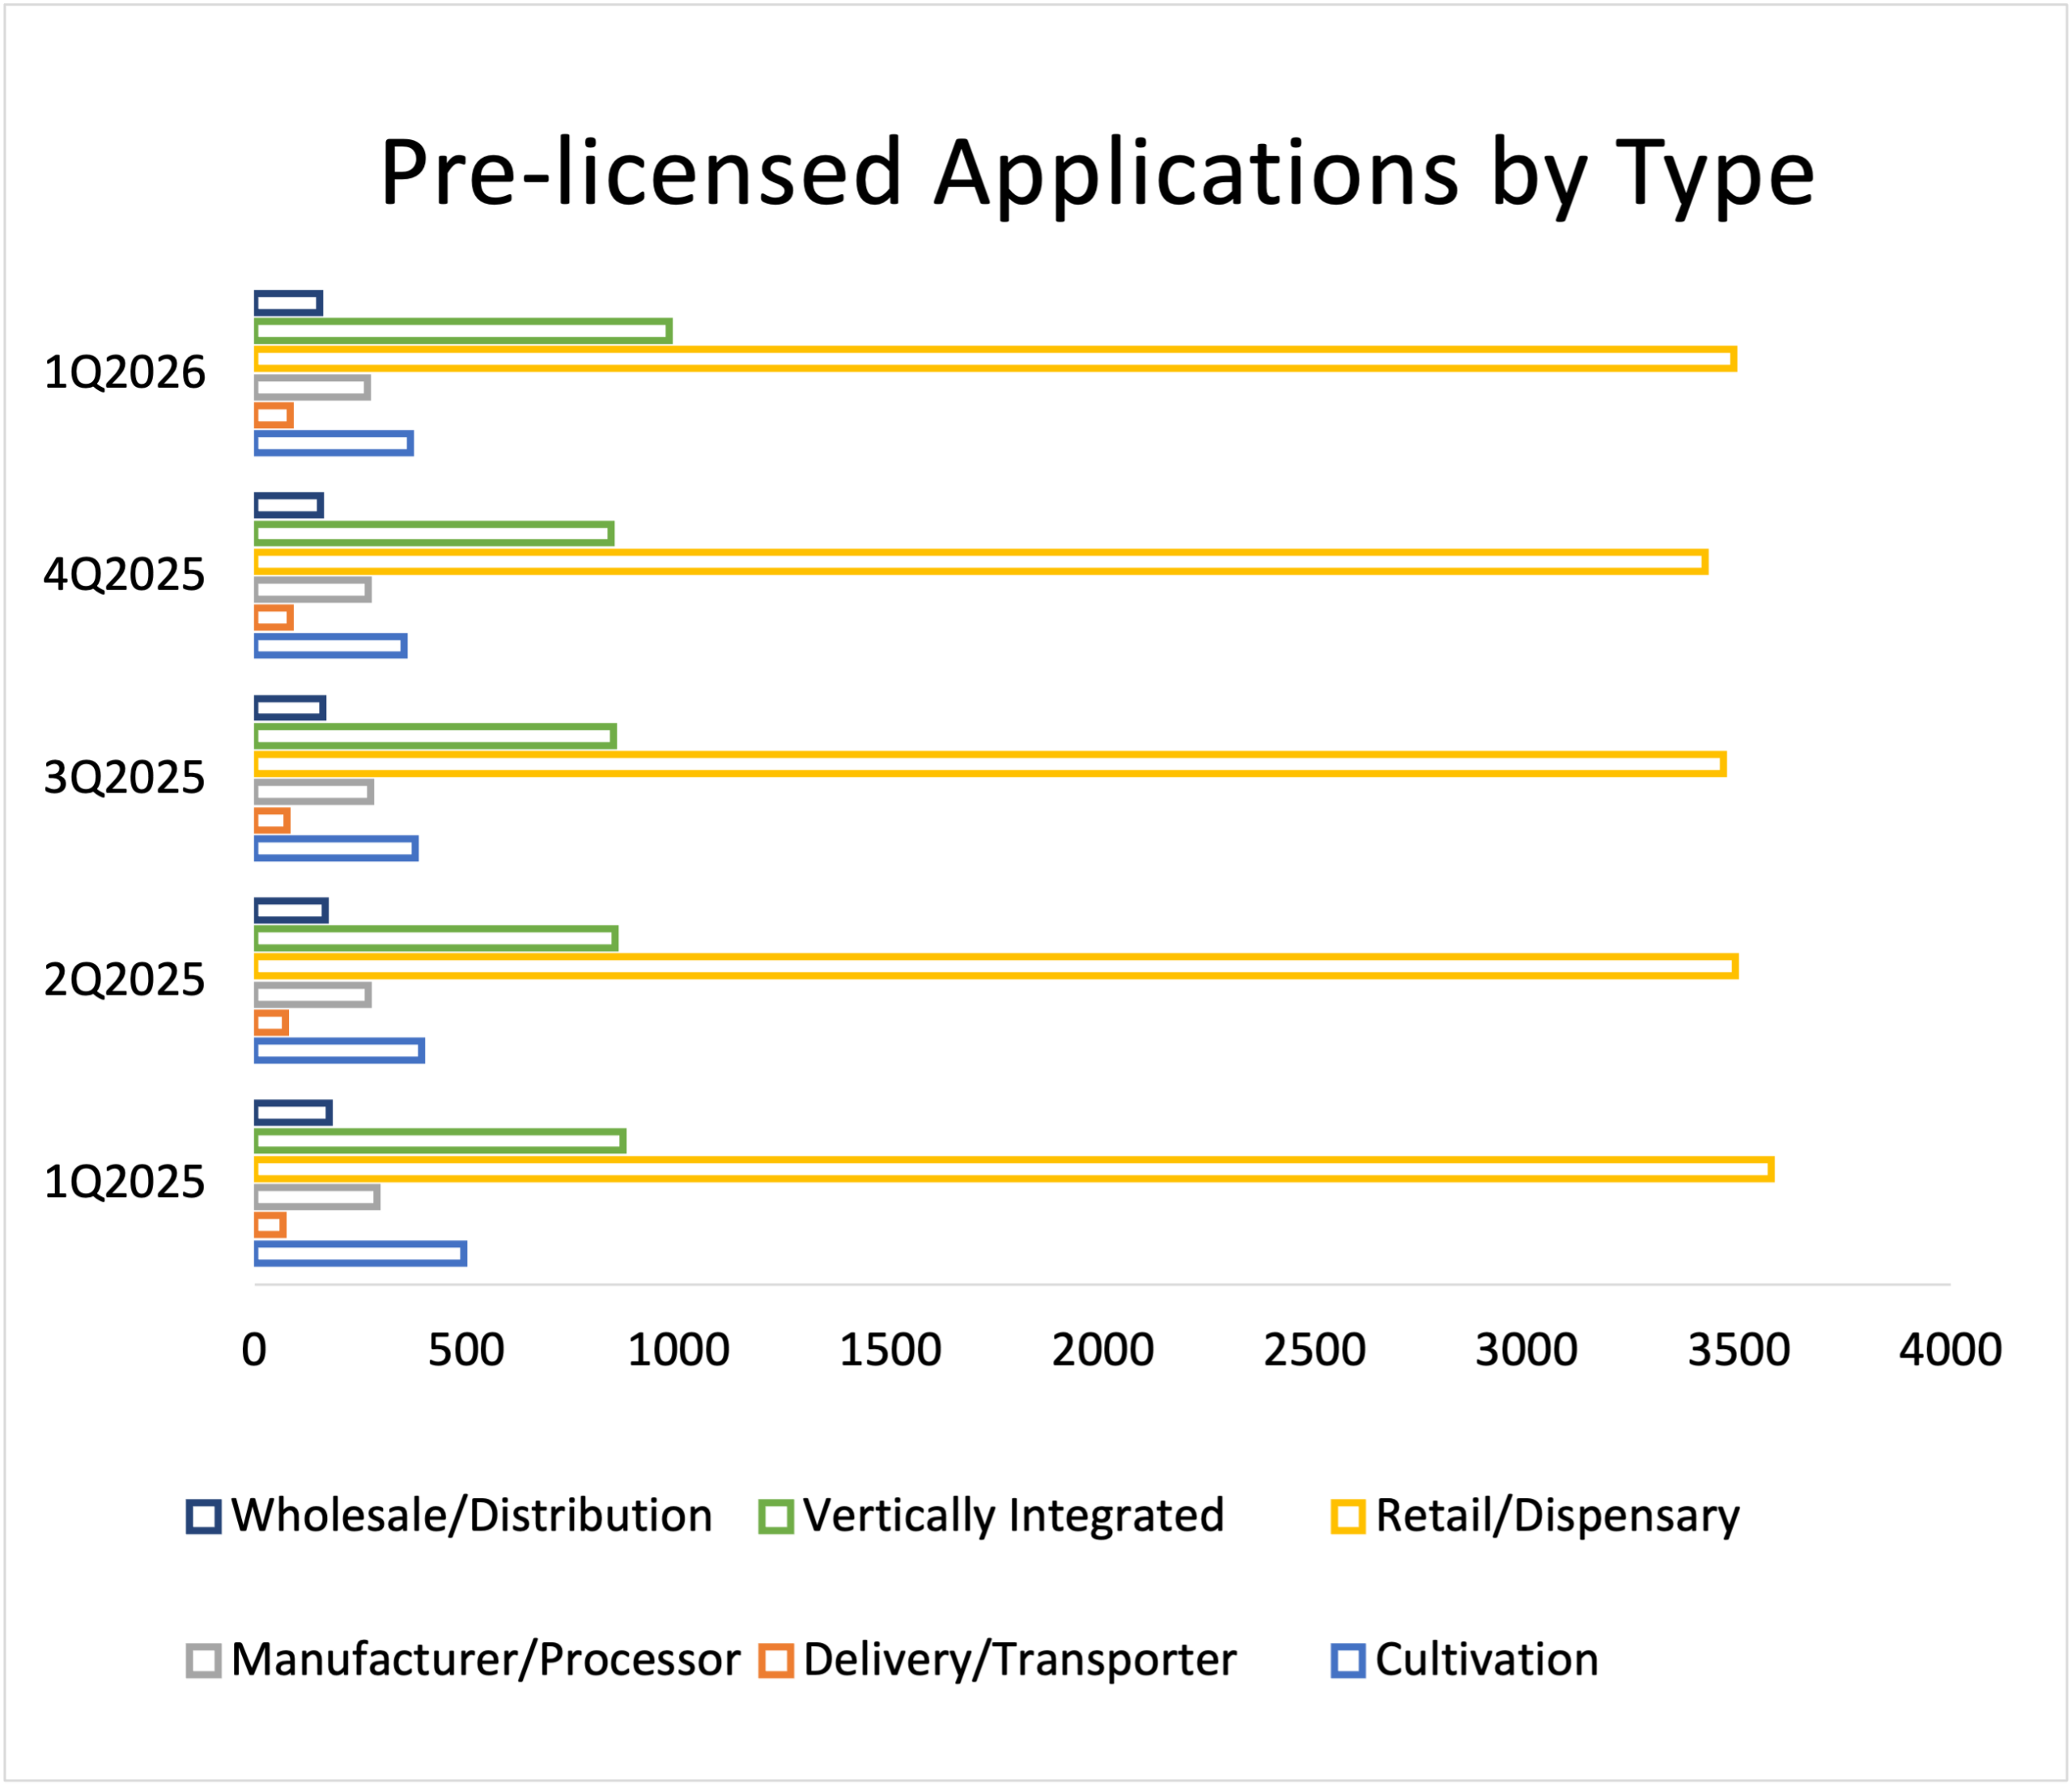 Applications for new cannabis business licenses that have been submitted for review are classified as having pre-licensing status. While the proportion that may succeed in gaining license approval is unknown, pre-licensing data serves as an indicator of interest in commencing or expanding commercial activities in a given market.
Applications in the pre-licensing phase fell 4% in the first quarter, marking the seventh consecutive quarterly decline. Pre-licensing totals ended the quarter 3% lower overall than a year ago. However, new application submissions rebounded across four of the six major license types: cultivators, delivery/transporters, dispensary retailers, and vertically integrated operators.
Vertical operators showed the sharpest growth, increasing 16% nationwide to nearly 1,000 permits in application, largely related to New York’s ongoing adult market standup and growth in regulator-mandated vertical markets in New Mexico, Florida, Minnesota, and Pennsylvania.
Retailers experienced the second largest absolute increase in new license applications, adding 68 to reach 3,488—a 2% increase in the quarter.
Cultivators added 15 applications during the quarter to reach 368, a 4% rise. Delivery/transporters rose 1%. Wholesaler/distributors and manufacturer/processors each fell 1%. Each of these license categories had experienced an extended period of declining application activity over the past two years.
As has been the case for more than two years, applicants in New York comprise the vast majority (93%) of retail operator applicants in review. Of 978 applications in pre-licensing nationally for vertically integrated operators, 841 were seeking New York permits.
Minor License Types
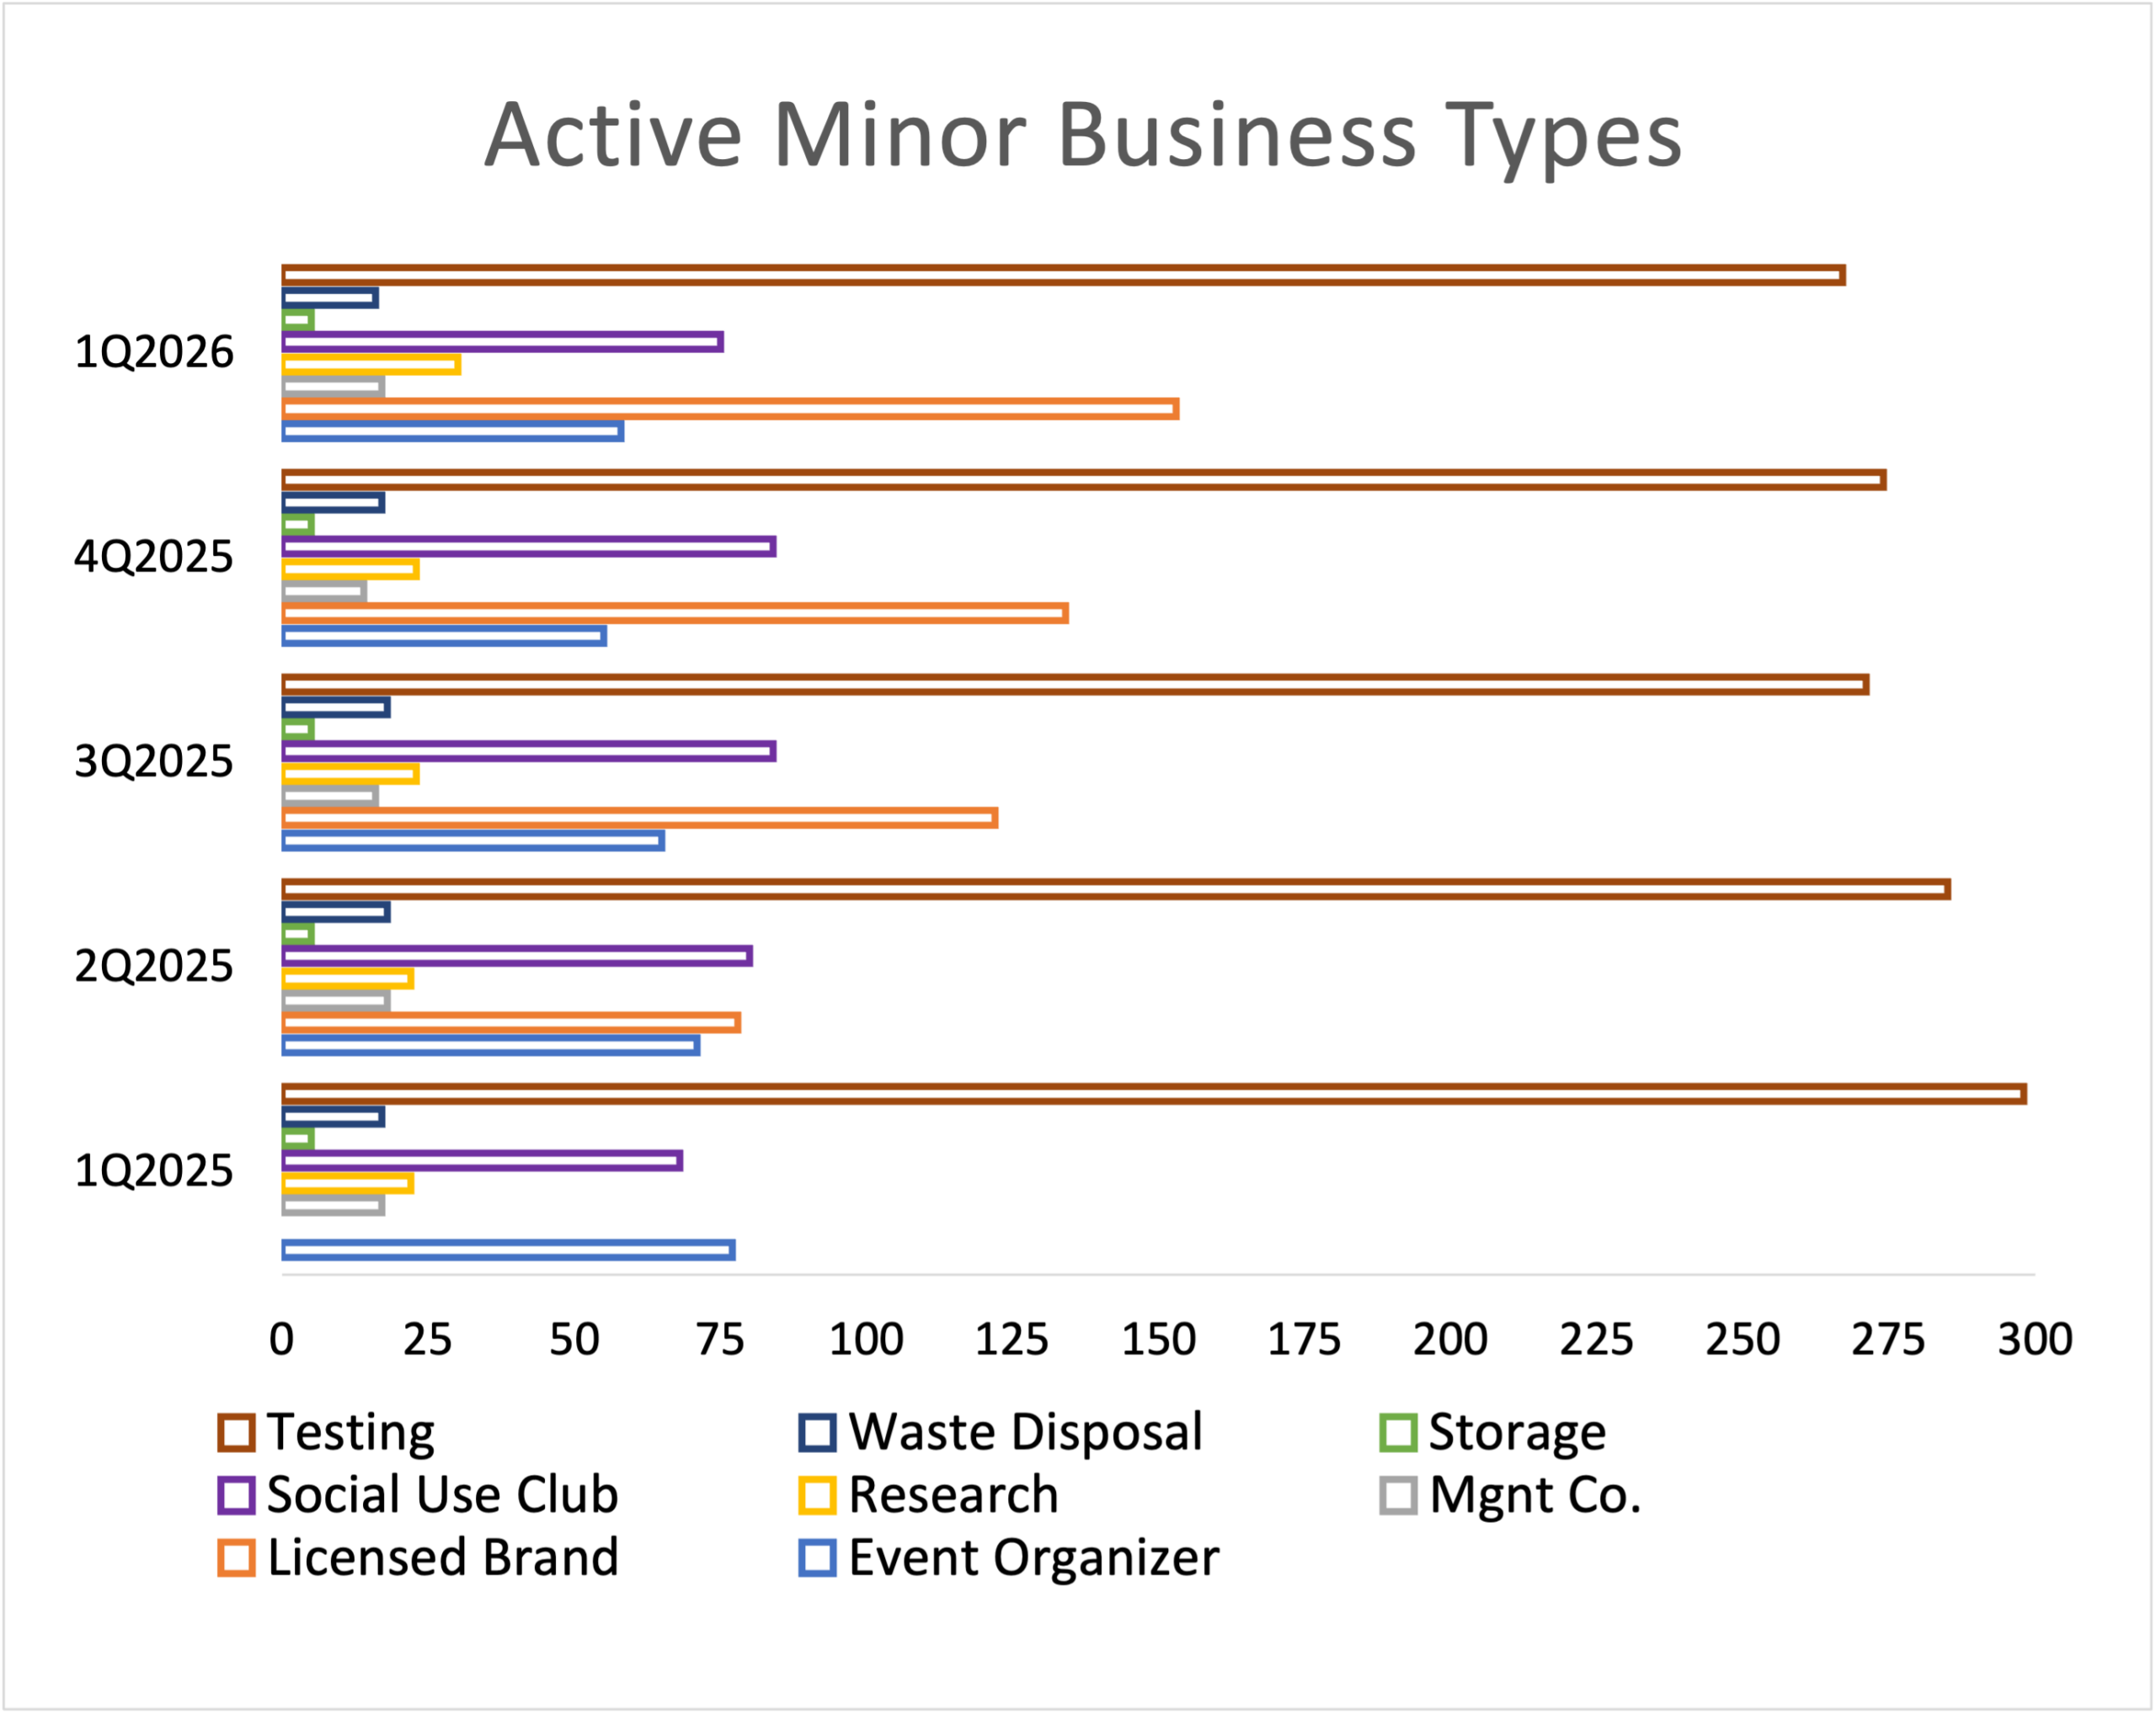 License types totaling less than 300 active licenses nationally are considered minor. These include event organizers, management companies, research organizations, testing facilities, social use clubs, storage, waste disposal, and—new in 2025—licensed brand companies. In the first quarter, only testing facilities totaled more than 175 nationally.
Licensed brand permits (available only in New York) grew 30% in the quarter to 153 permitted operators, making the one-year-old category the second largest minor licensing category after testing facilities.
Testing facilities, the largest minor type, lost 3% of active licensees, ending the quarter with 267 operators nationwide. Social club operators showed the sharpest rate of decline among minor types, shedding 11% of active licensees to 75 permitted operators at the end of March. This drop reversed two years of strong growth led by a surge of new licensees in New Mexico joining established social use markets in Colorado and Michigan.
Event organizers added five new licensees to rise 5% for the quarter, the first growth seen in the category in three years.
Management company licensees grew 21% in the quarter, adding three active licensees nationwide, reversing a sharp 26% decline in 2025. Waste disposal operators fell another 6% in the quarter.
Established Markets
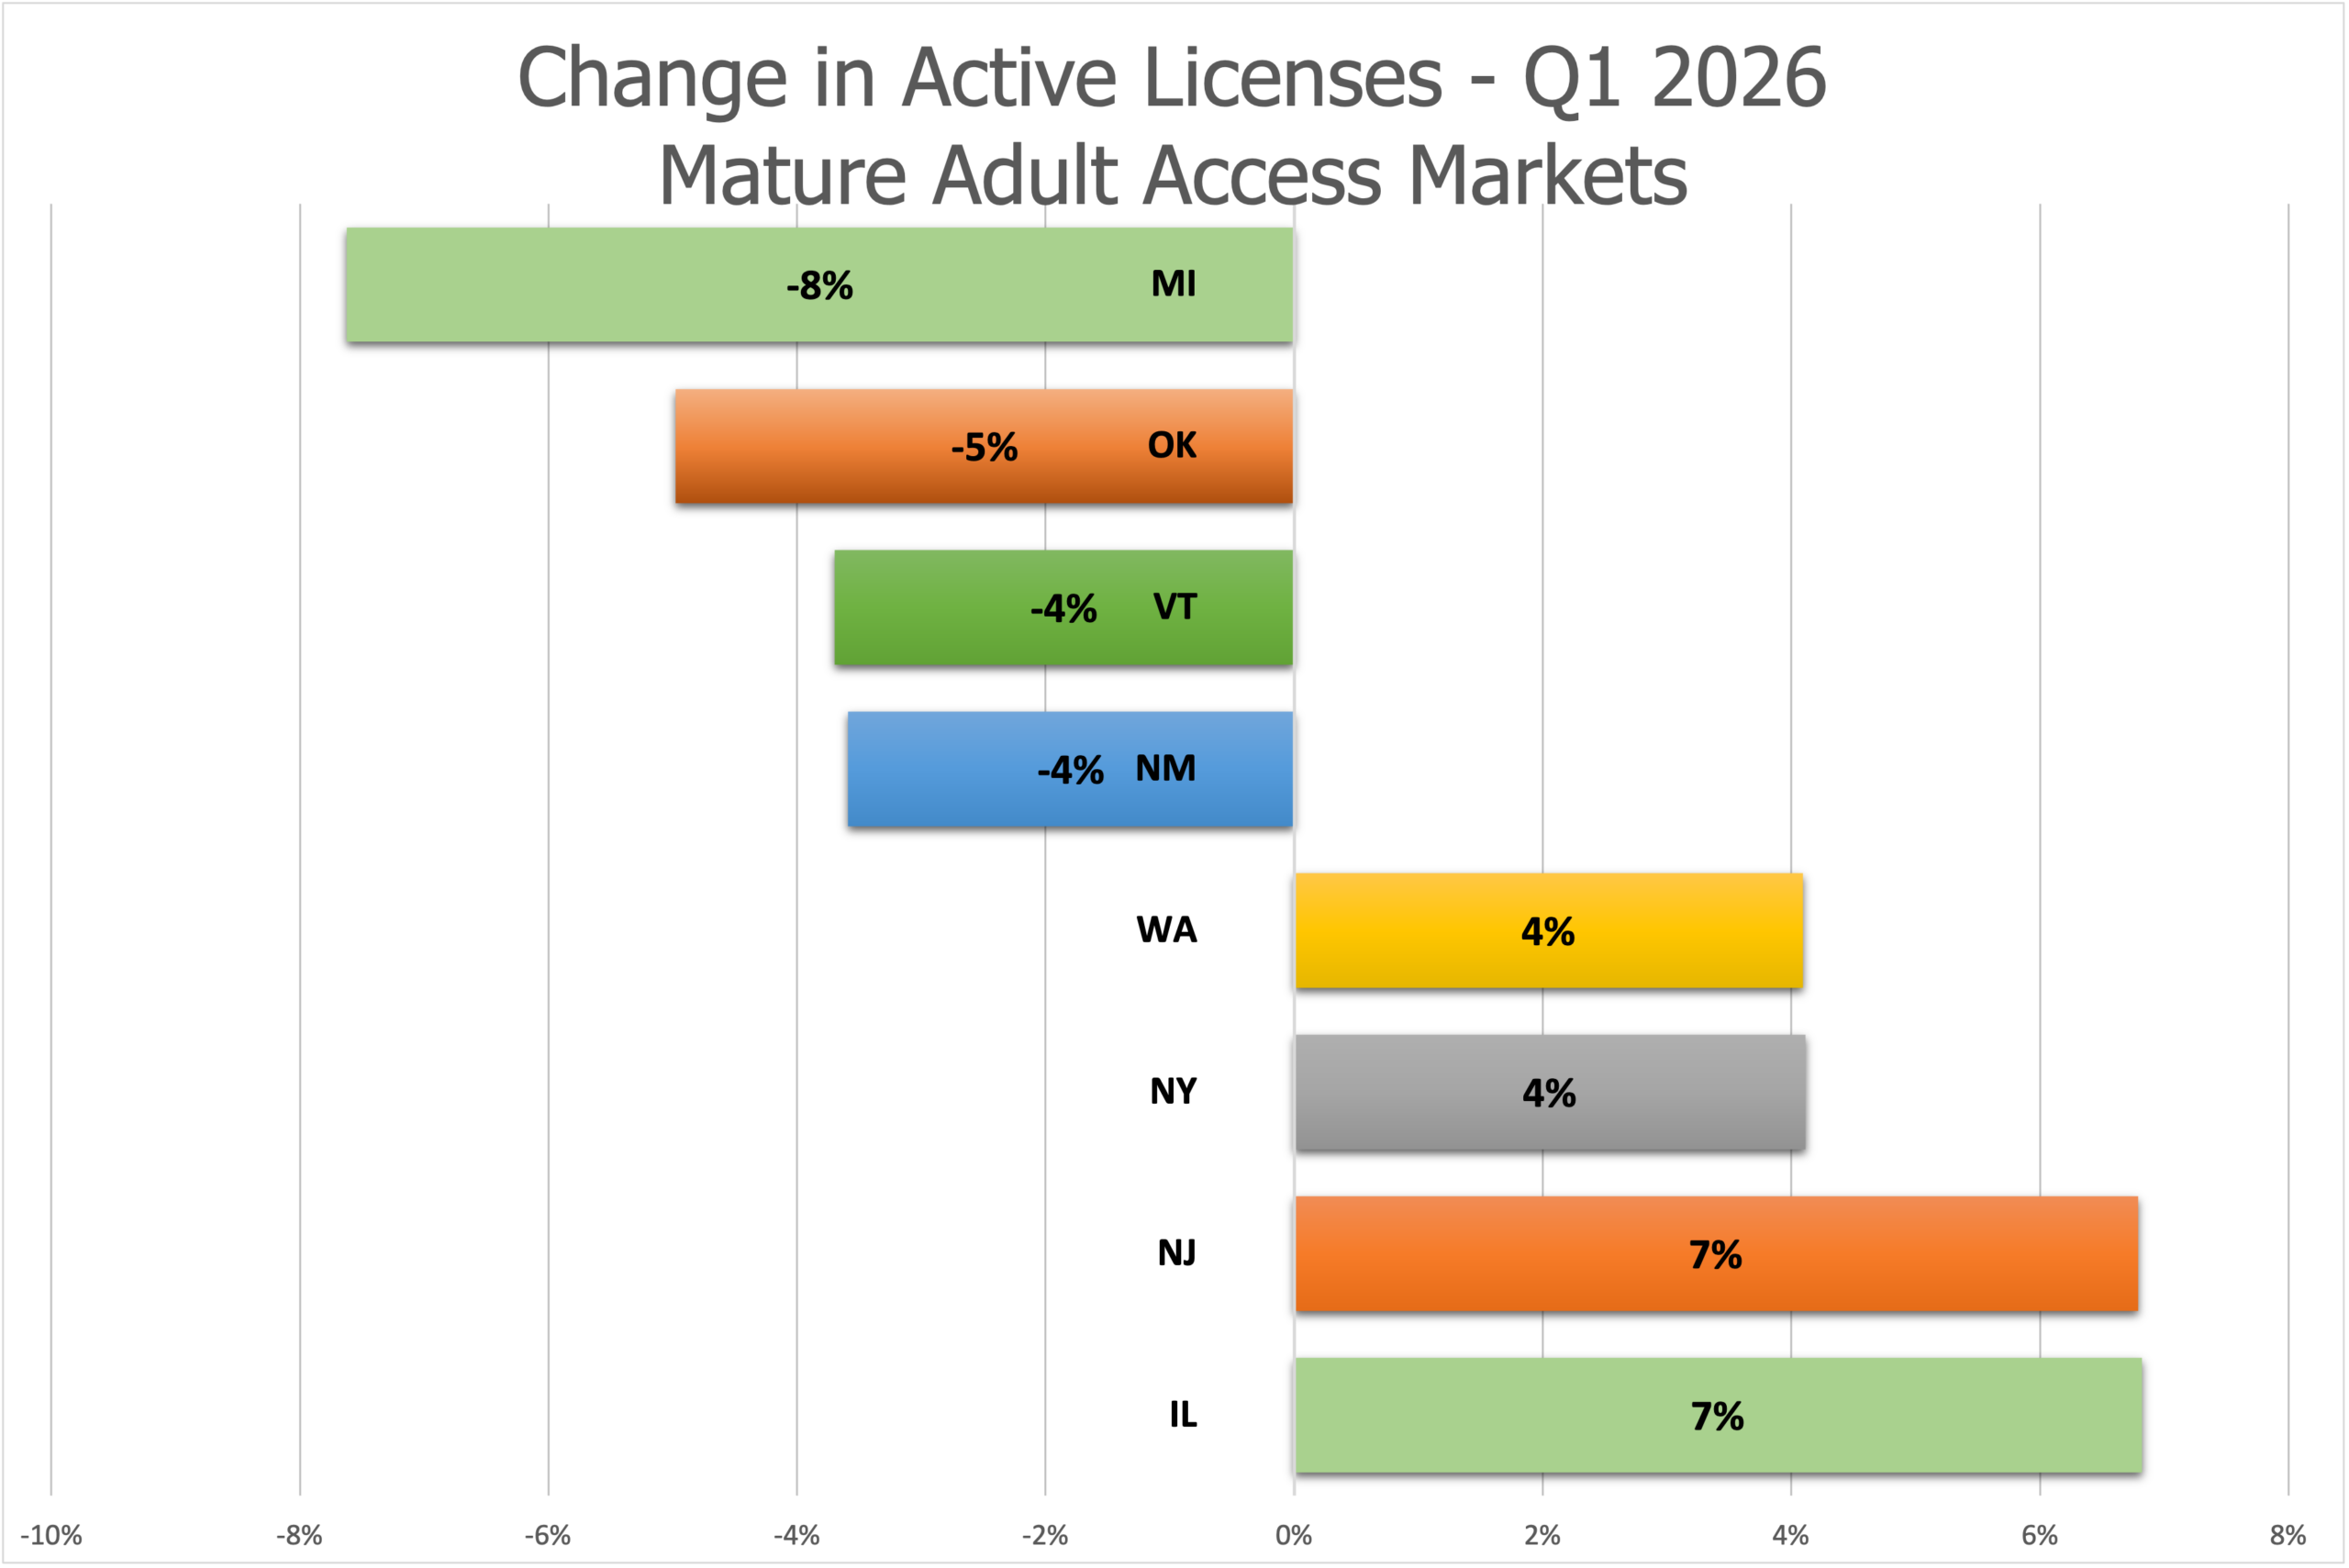 Licensing trends in the 20 states with established cannabis markets—those two years and older with more than 300 licensed operators—were mixed in the first quarter. Total license counts ranged from 7% growth in Illinois and New Jersey to an 8% decline in Michigan.
New York, Washington, Missouri, Maine, Alaska, and Oregon added to their active licensees, while Colorado, Oklahoma, Vermont, New Mexico, Montana, California, Massachusetts, and Nevada saw declines.
Washington led established markets with the greatest absolute increase, adding 107 new licenses (a 4% increase) to close March with 2,723 active permits. The state is implementing a social equity licensing mandate which is expanding active licensees after years of stalled growth.
Michigan, Oklahoma, and California experienced the largest absolute declines. Michigan lost more than 300 active licensees in the quarter. Oklahoma dropped 227 licensees, while California shed 154 licenses. Vermont and New Mexico each shed 4% of active permits.
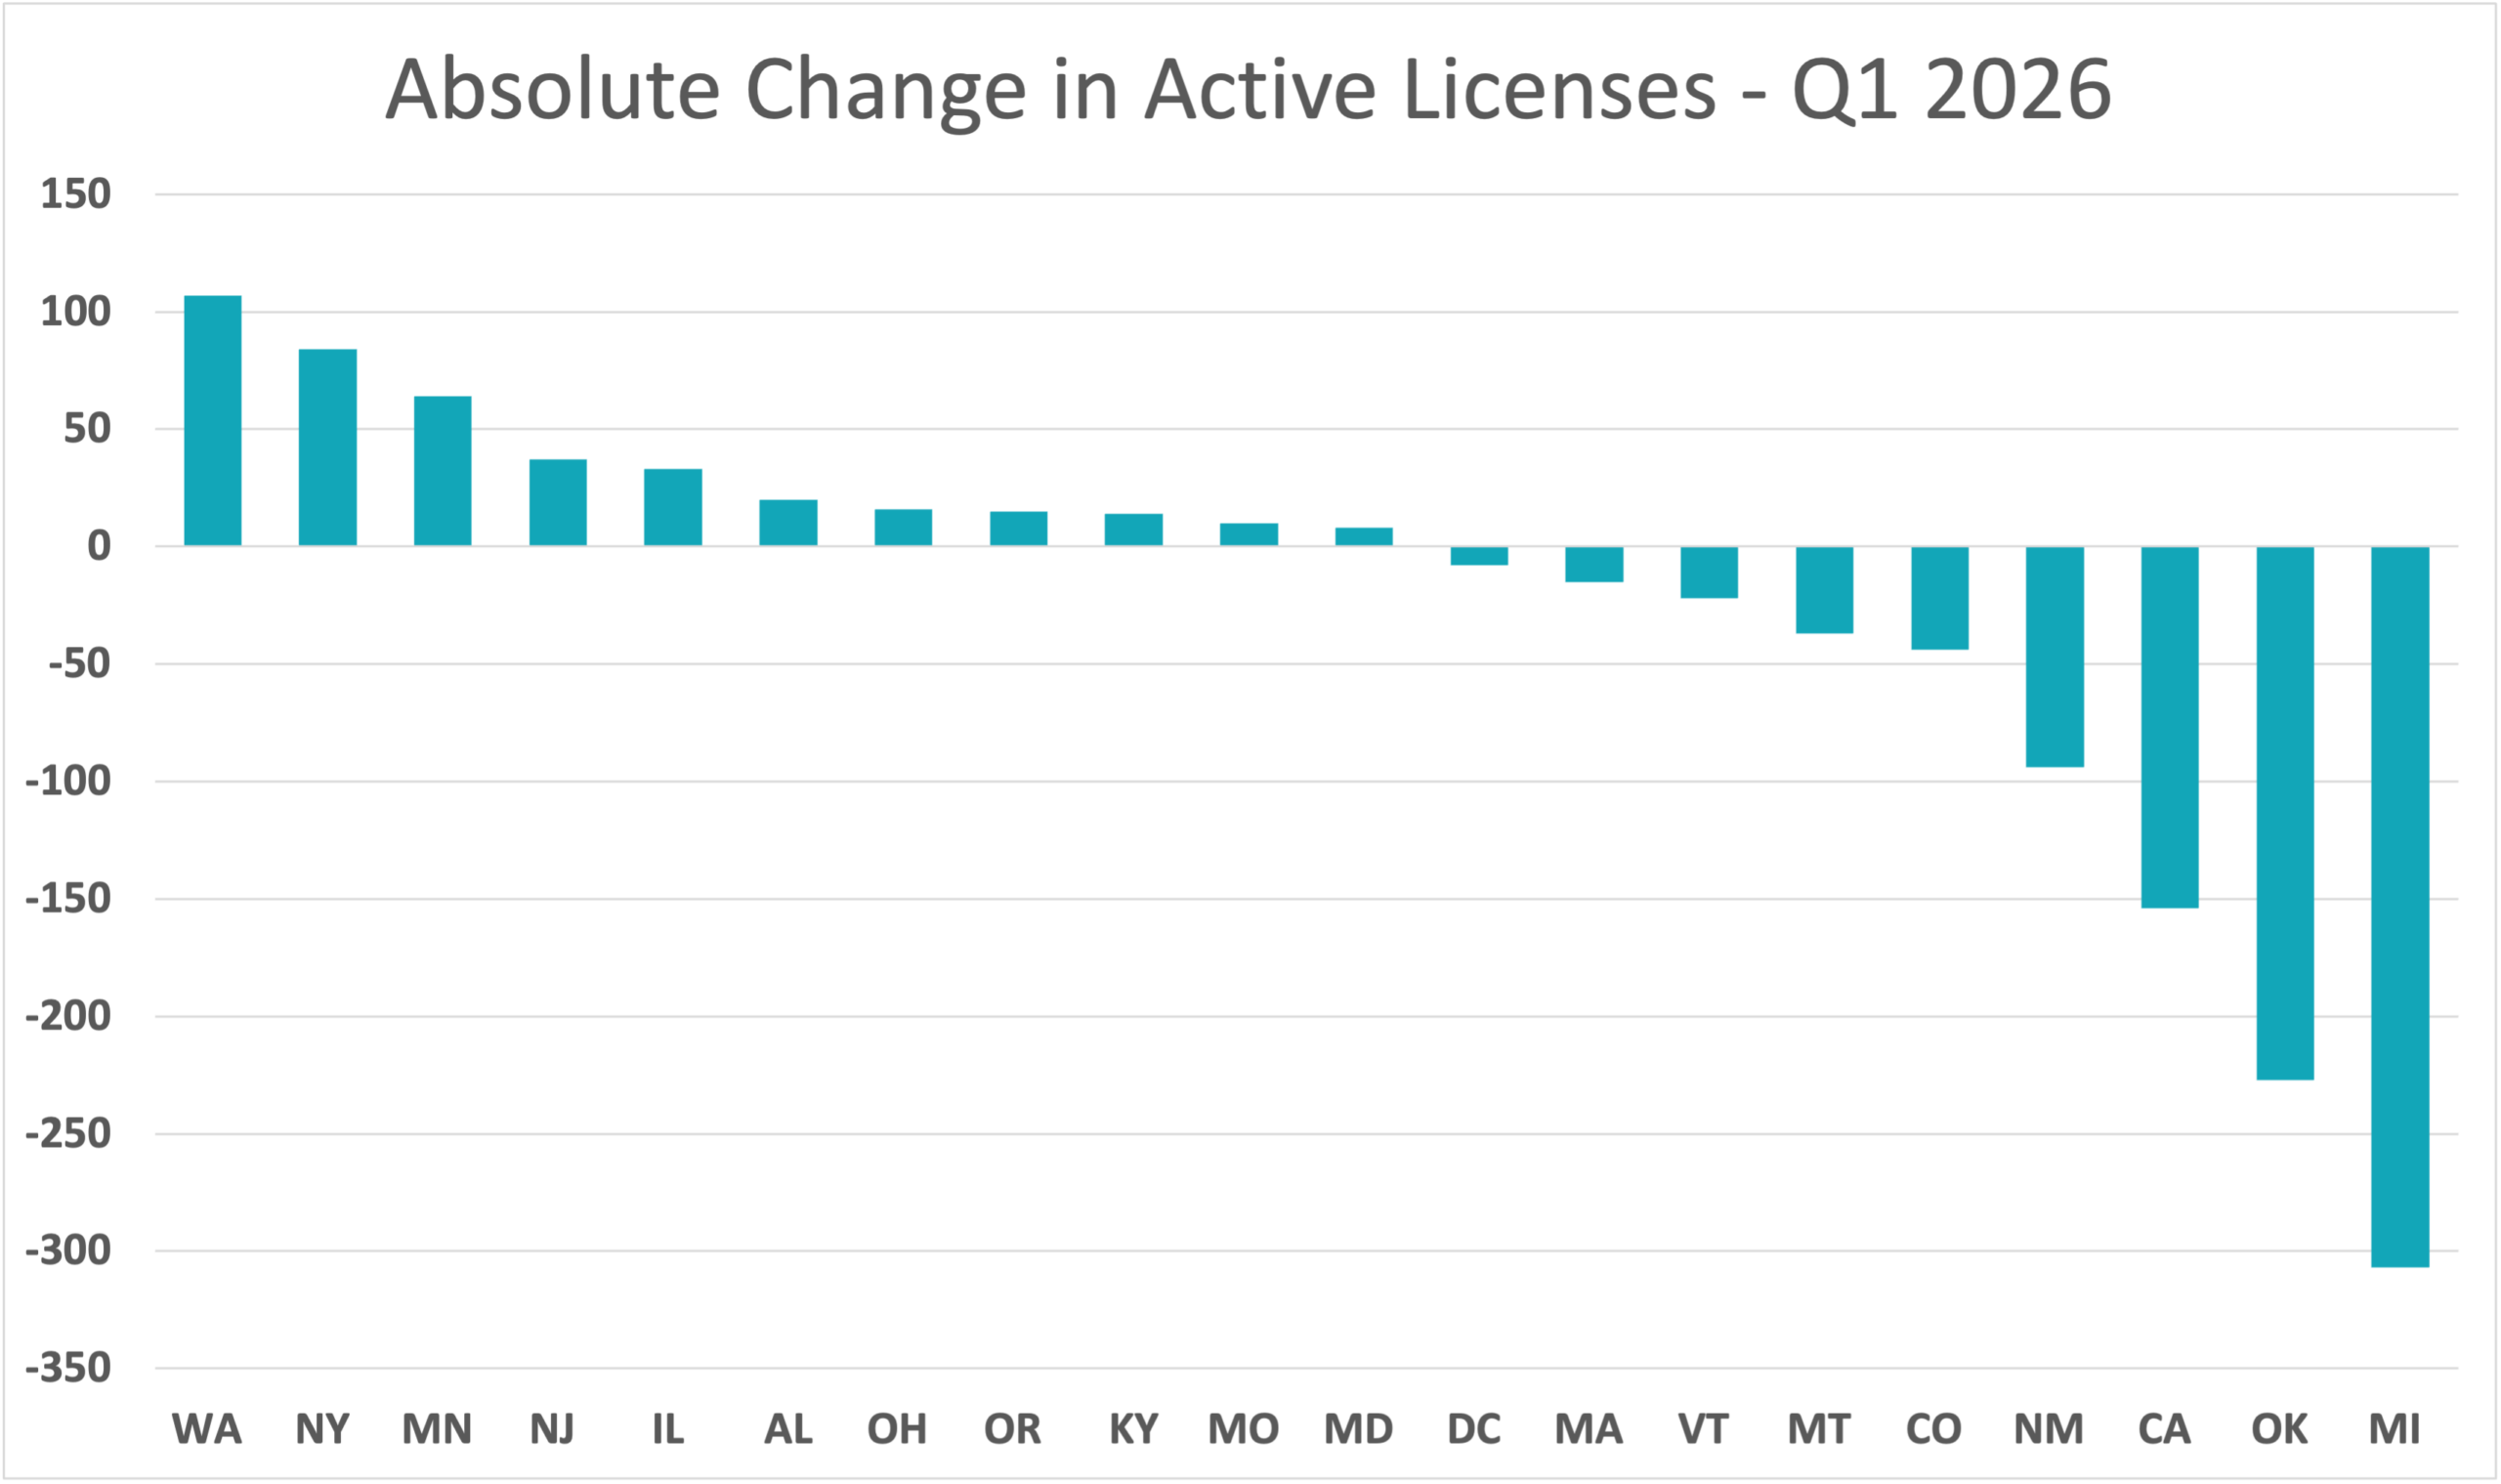 Michigan, the third largest U.S. market, lost 8% of its licenses in the quarter, ending March with 3,719 active licensees. The state’s active license count has fallen 10% over the past year, after peaking in Q3 2024 at nearly 4,500 licensees.
Three and a half years into a moratorium on new permitting and a crackdown on non-compliant operators, Oklahoma shed another 5% of its licensed cannabis businesses in Q1. The state’s active licensees fell to 4,333, marking a 49% plunge over the past two years. Nonetheless, Oklahoma remains the second largest state cannabis market behind California in total active licensed businesses.
Emerging & Growth Markets
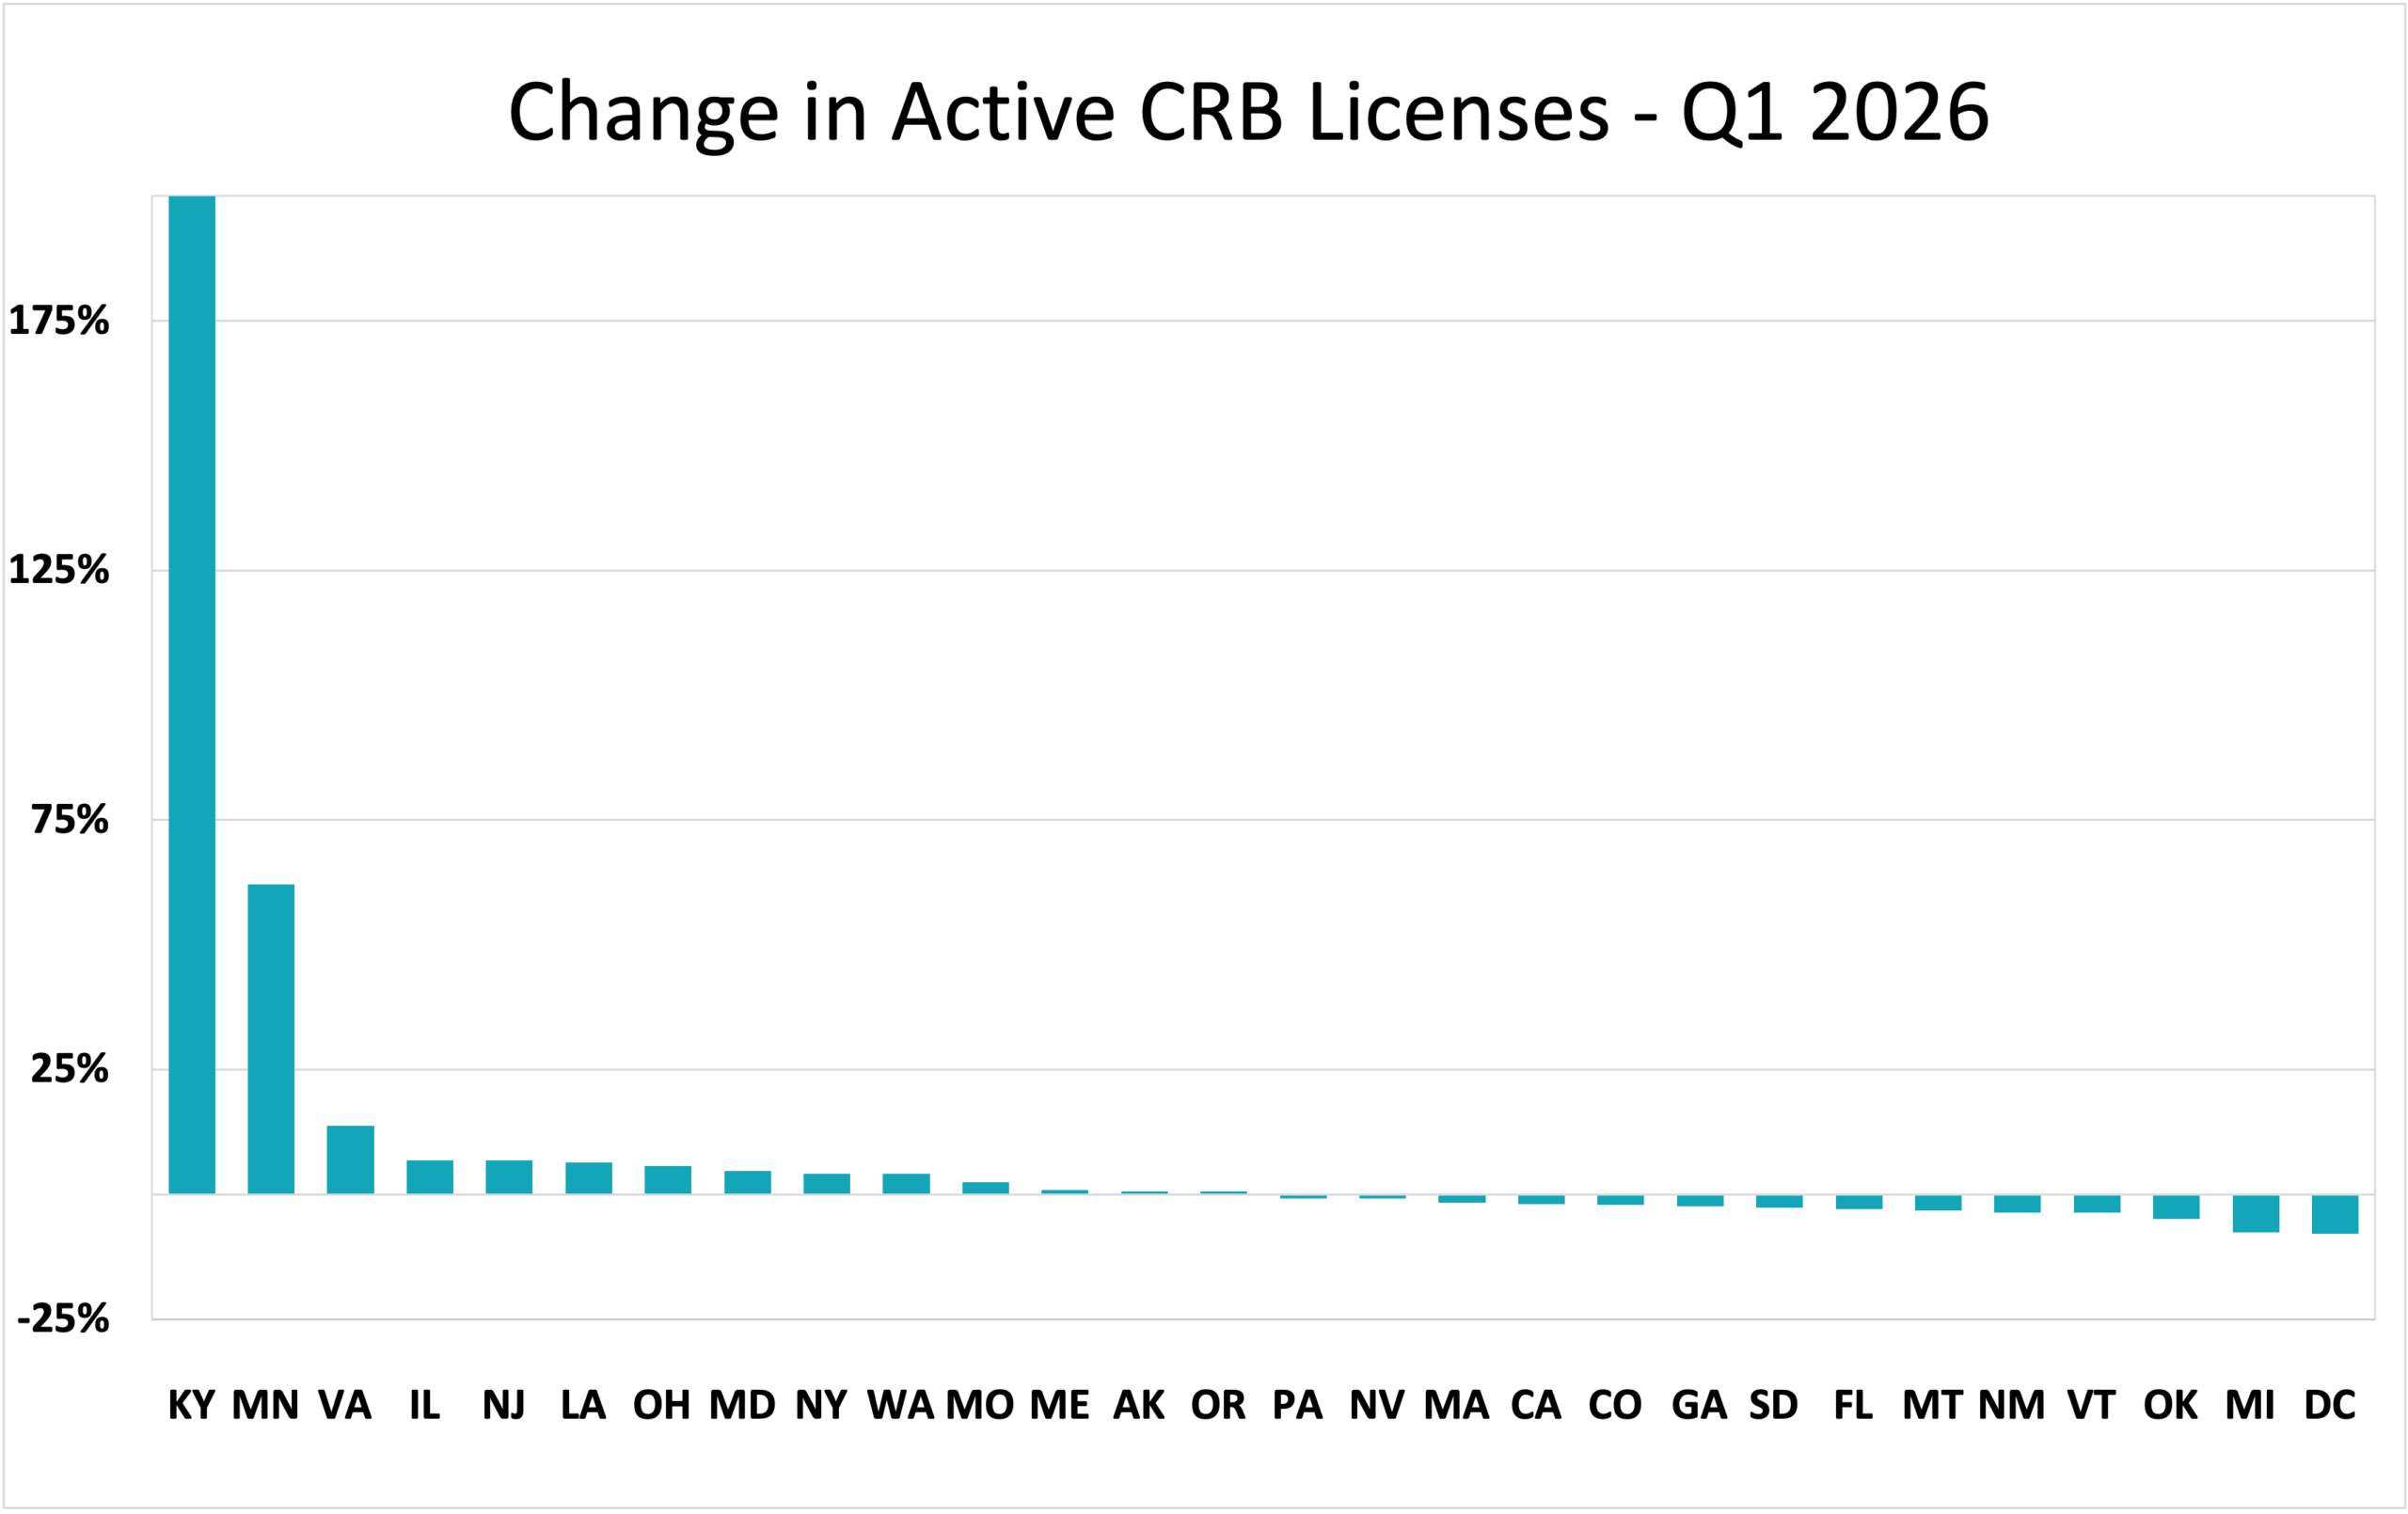 Kentucky grew 200%, adding 14 licensees in its medical-use rollout. Minnesota added 64 licensees, increasing its licensed market 62%.
Alabama awarded 20 licenses to operate medical dispensaries across the state following years of lawsuits and licensing delays. Virginia expanded its slowly opening adult-use licensing program 14%, adding 4 licensees. Illinois (+33), New Jersey (+37), Ohio (+16), and Maryland (+8) each grew their markets by 5-7% over the quarter.
Overall, 15 of 48 U.S. licensed state and territorial markets gained licensees in the quarter, while 15 states lost licensees. Only New Mexico, Oklahoma, California, and Michigan lost more than 50 active licenses. Eight states experienced 5% or greater growth, and 25 other markets were stable with a variance of less than 4%. The modest growth in new-market states and general stasis in established markets is a welcome sign of stability after three years of right-sizing and retrenchment.
New License Approvals by State
 Approved and pending cannabis license counts increased in eight U.S. states in Q1: Washington, California, Massachusetts, U.S. Virgin Islands, Guam, Pennsylvania, and Rhode Island. Washington had the largest absolute increase, approving 13 new licenses. The Virgin Islands (+11) was the only other jurisdiction to approve more than five new licenses in the quarter.
Approved/pending counts fell by 10 or more in eight states and by 10 or less in six others. The sharpest decline was in Illinois, which reduced its pending and approved permit pipeline by 44 to 274. New approvals fell by 10 or more also in New York, Ohio, New Jersey, Missouri, Maine, Kentucky, and Alabama.
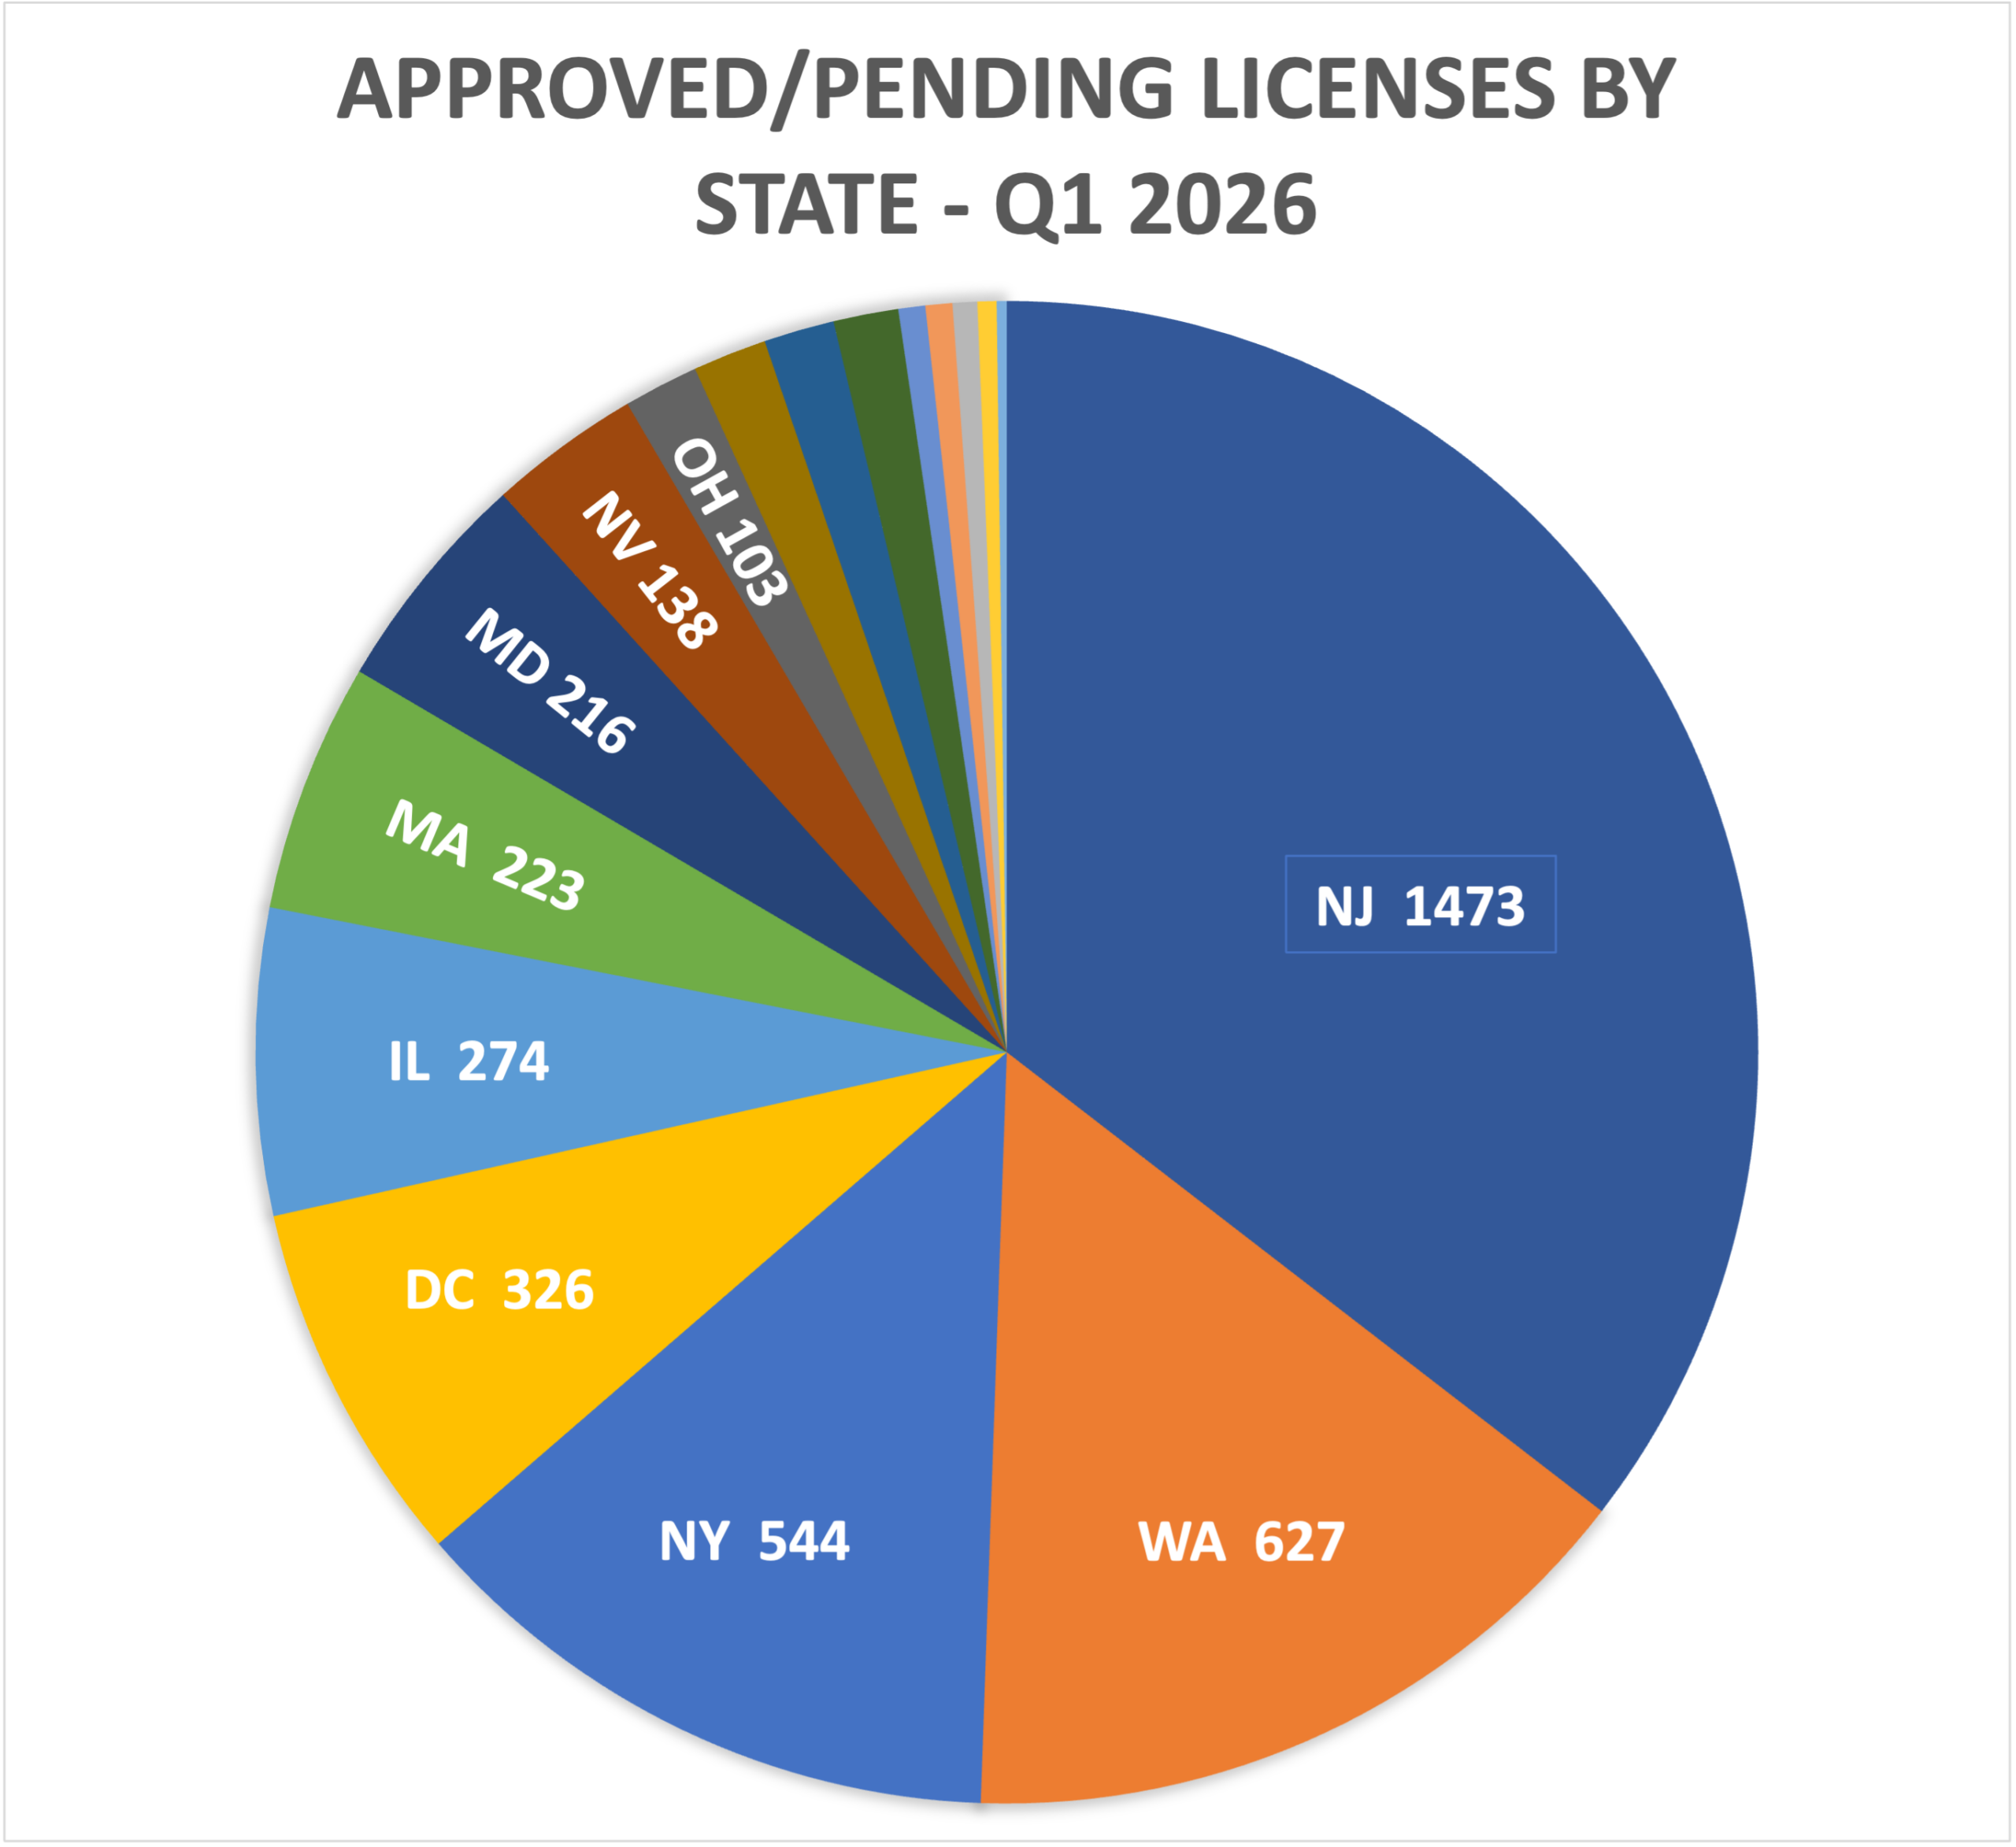
New Jersey once again had the most approved licensees awaiting commencement of operations, with 1,473 licenses pending activation—13 fewer than it ended the year with and 2% lower than Q1 2025. The state’s extensive multi-jurisdiction review process has caused significant delays between conditional and final approval of new operators.
Washington’s social equity licensing initiative drove its newly approved licenses pending activation to 627 at the close of March. New York ended the quarter with 544 new approvals, a 6% decrease for the quarter and 27% lower than a year ago.
Pre-Licensing by State
 Applications for new cannabis business licenses were active in 13 states during the quarter. Texas and Rhode Island attracted the most new applicants—147 and 83, respectively—as Texas rolled out a low-THC medical licensing program and Rhode Island raised its recreational dispensary license limit for the first time since the state’s 2022 legalization of adult-use sales.
Only ten states recorded an increase in application submissions; 44 had decreased permit submissions or none at all.
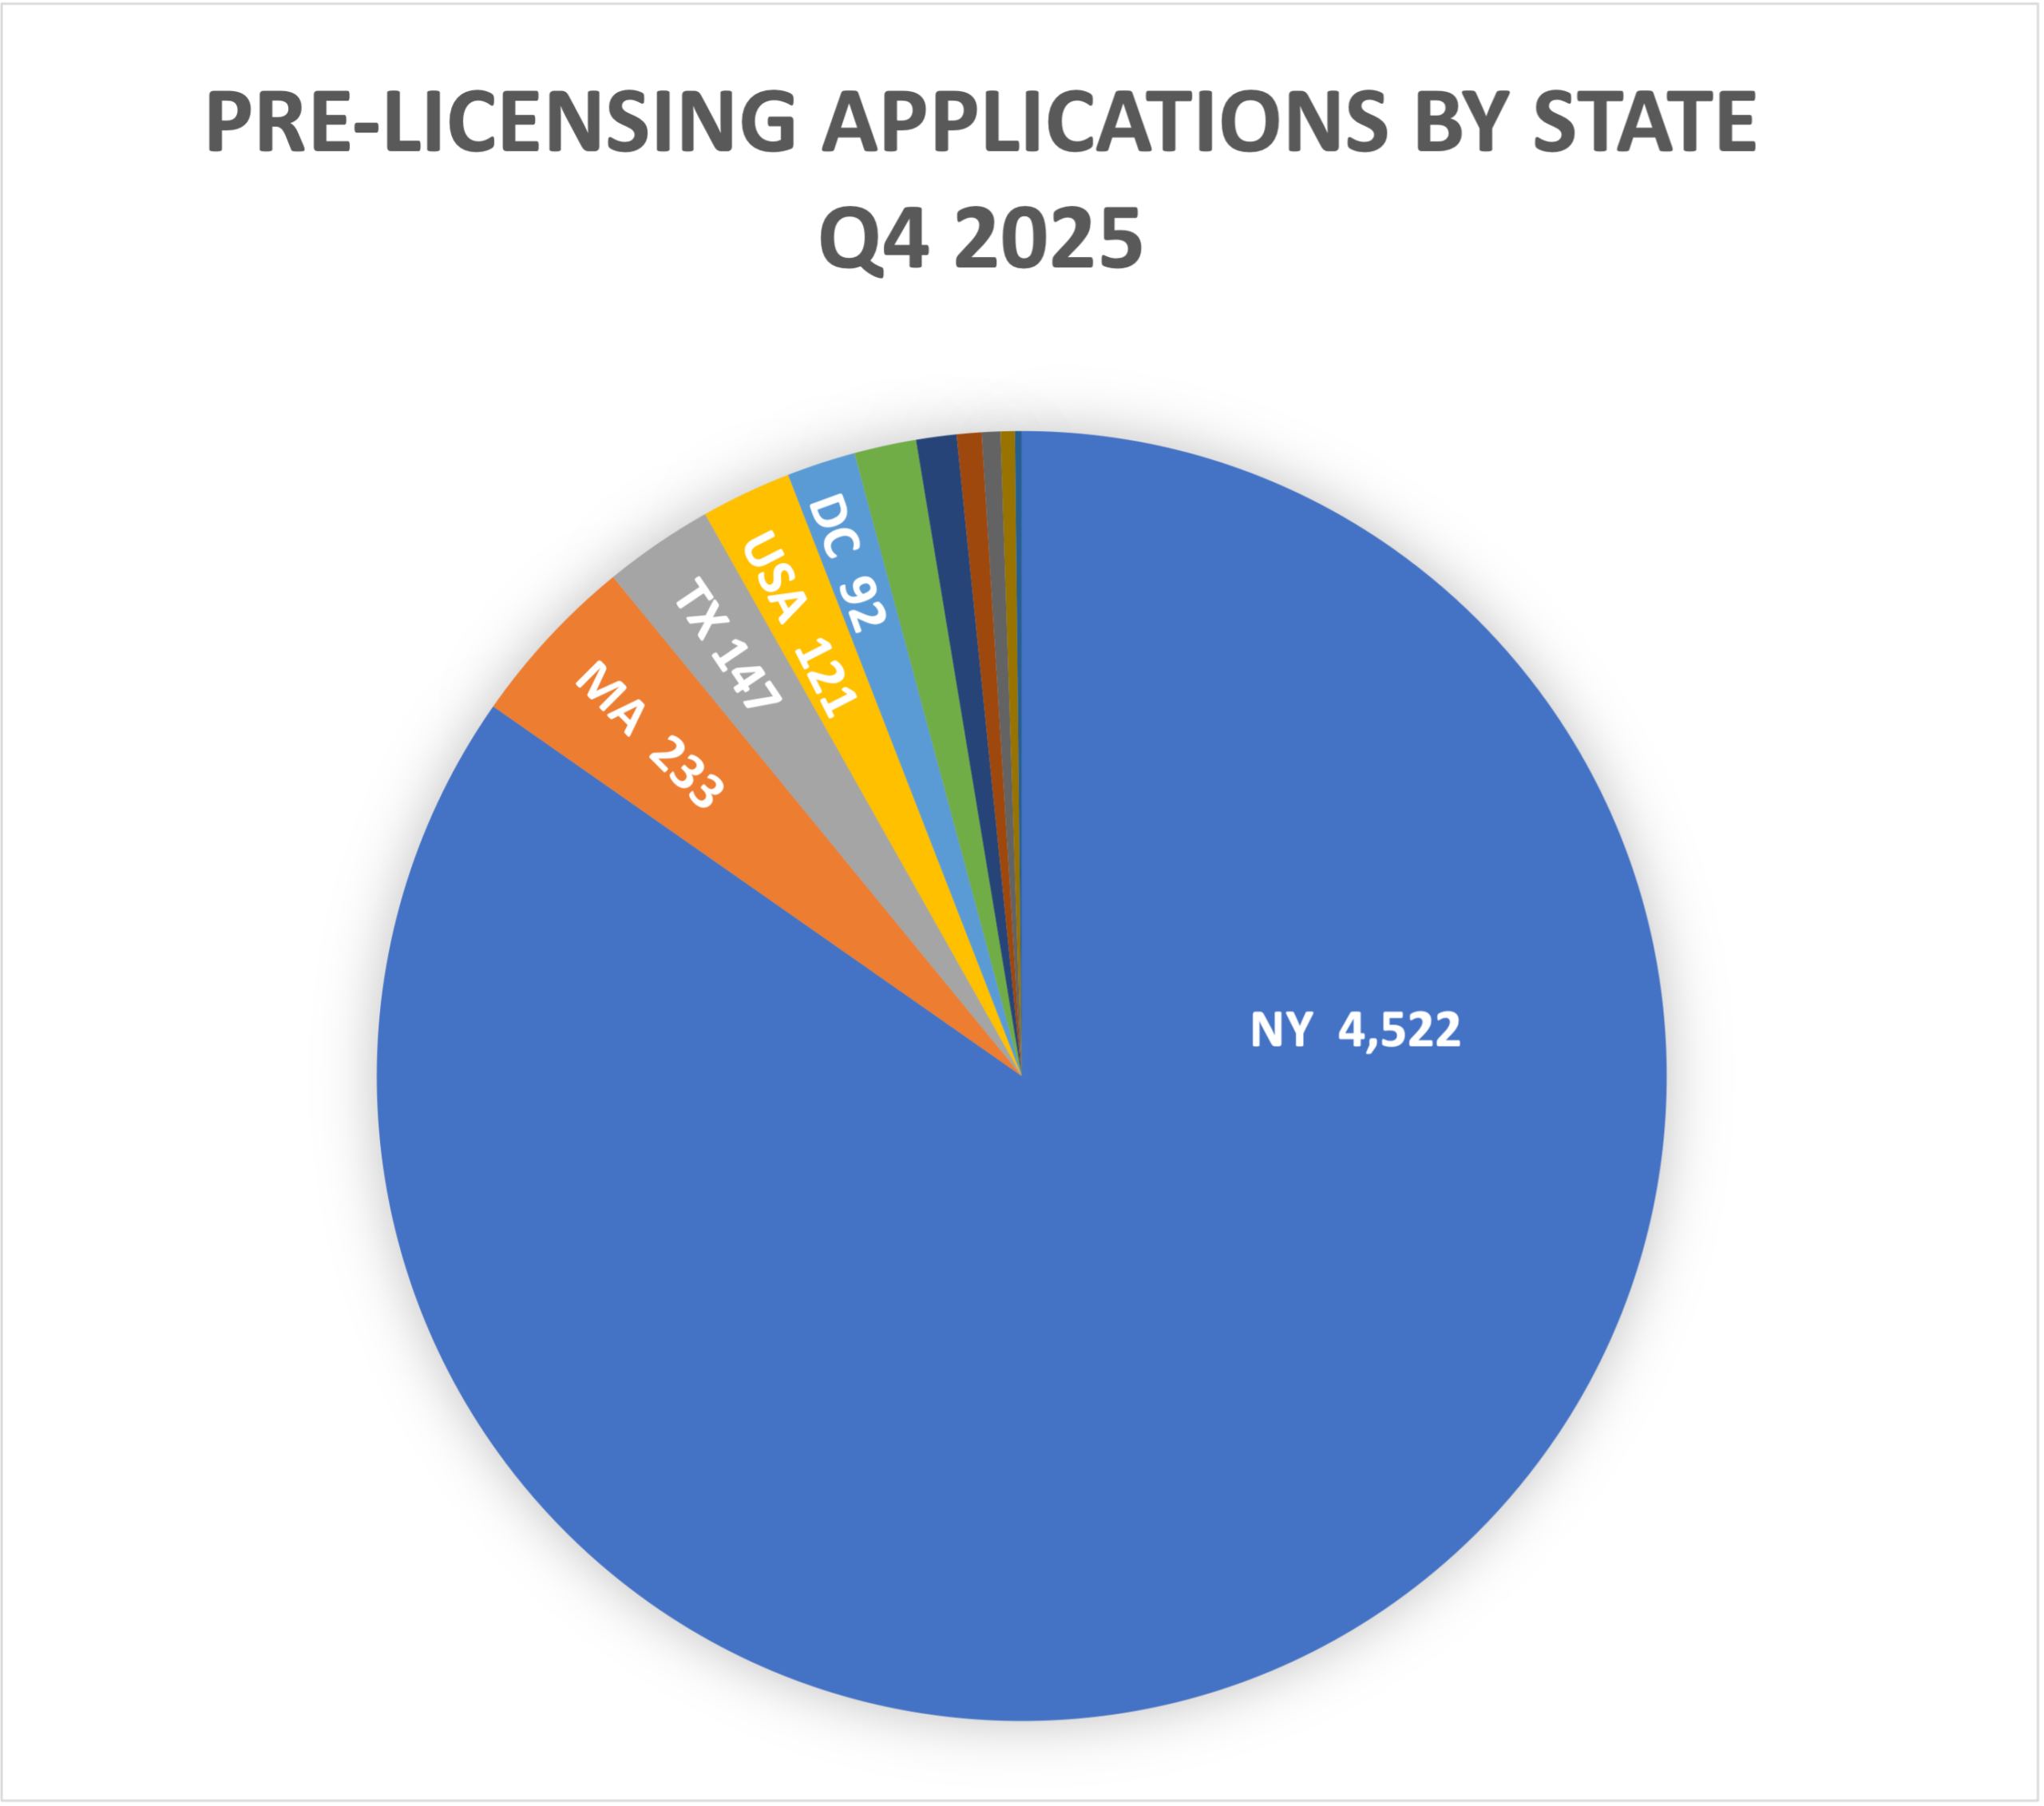
New York continued to have the largest number of applications in pre-licensing, with a backlog of 4,522 permits in application—a 1% decrease for the quarter and 5% decrease over a year ago.
Massachusetts was a distant second, with 233 applications in pre-approval, a 5% drop from the prior quarter and 3% lower than a year ago.
Notably, numerous large state markets saw no license application activity at all during the quarter, including California, Colorado, Florida, Illinois, Michigan, Ohio, New Jersey, New Mexico, Missouri, Oklahoma, and Oregon. Established cannabis powerhouse California ended 2025 with only seven new license applications in processing—a situation unchanged for six quarters.
Conclusion
The first quarter of 2026 presented a bifurcated landscape for cannabis business licensing in North America. The U.S. market continued its multi-year contraction in active licenses, though the rate of decline moderated in some established states. New York’s persistent backlog of thousands of applications remains a dominant feature of the national licensing landscape, while emerging programs in Texas, Kentucky, and Minnesota generated most of the new application activity. Canada, by contrast, has settled into a stable equilibrium with virtually no net change in operator counts for more than a year. Across both markets, the era of rapid license expansion appears to have given way to a period of consolidation, rationalization, and selective growth driven by social equity mandates and newly opened medical or adult-use programs.
Click below to download the full report